Apple plus Tivo
Tysabri kills somebody
I value Berkshire
Monday, February 28, 2005
OT-Hunter S. Thompson
I suppose I'm probably kinda late to the party on this one, and I'm not sure it has much too with money or markets, but I read this article today on the suicide of Hunter S. Thompson, and I can't help it.
The Money Quote:
Anita Thompson, 32, said her husband had discussed killing himself in recent months . . .His suicidal talk put a strain on their relationship, she said.
"He wanted to leave on top of his game. I wish I could have been more supportive of his decision," she said. "It was a problem for us."
"I wish could have been more supportive of his decision"?????!!!!!?????
I truly don't know whether to laugh or cry at this one. A spouse's suicidal ideation is a "problem" for the relationship? The other spouse doesn't think it's a good idea, but is actually regretful that she can't be more "supportive" of his pathology?
"It's not you, dear, it's me; I wish I could support you in your misguided desire, but I can't, and I hate myself for it. I'm not really sure how our relationship is going to survive your wish to kill yourself."
I guess all I can say is that if you or someone you love needs help please seek it.
Valuing Berkshire Hathaway
Warren Buffett is one of the great value investors, and his Berkshire Hathaway company is a great company. But is it always a great stock? Over the past 5 years, buyers of BRK have done well or badly depending on when they bought—at 45,000 or 95,000. Valuing this company is tricky—although its main business is insurance, it owns furniture stores, gas pipelines, jewelers, World Book Encylopedia, and has major stockholdings including American Express, Coke, etc. I'm not nearly smart enough to value this company, but I know one guy who is--Warren Buffett himself. Buffett talks a great deal about intrinsic value (IV) of Berkshire, or what the company is really worth based on the net present value of future cash flows.
At the 1998 Berkshire Hathaway annual meeting, Mr. Buffett defined intrinsic value as follows: "In order to calculate intrinsic value, you take those cash flows that you expect to be generated and you discount them back to their present value - in our case, at the long-term Treasury rate. And that discount rate doesn't pay you as high a rate as it needs to. But you can use the resulting present value figure that you get by discounting your cash flows back at the long-term Treasury rate as a common yardstick just to have a standard of measurement across all businesses."
A value investor like Buffett would want to buy companies, even a great company like Berkshire, at some discount, a margin of safety (MOS) to intrinsic value.
Though he's never publicly stated what he thought Berkshire's IV was, at one point in the recent past, however, Buffett telegraphed, with a big wink and nudge, just what he thought IV-MOS was.From the 1999 Chairman's letter (March 2000), "Recently, when the A shares fell below $45,000, we considered making repurchases. . . we will make them if and when we believe that they represent an attractive use of the Company's money."I believe one can safely infer that Buffett believed IV-MOS in March 2000 was $45,000 per A share and thus $1500 per B share(the shares are convertible at a rate of 30:1). What is it now? Assuming MOS is a constant percentage of IV, the question becomes how much has IV changed since then. As always, we return to scripture for the answer. From the 2000 Chairman's letter (March 2001), "we believe Berkshire's gain in per-share intrinsic value moderately exceeded its gain in book value"--and book value gain was 6.5%. Moderately exceeded means 7%, 8%? This gives a range of $48,150 to $48,600 per A share and $1605 to $1620 per B share in March 2001.
From the 2001 Chairman's letter (March 2002), "Per-share intrinsic grew somewhat faster than book value during these 37 years, and in 2001 it probably decreased a bit less"--and book value decrease was 6.2%. Is decreased a bit less 6%, 5%? This results in a range of $45260 to $46170 per A share and $1508 B to $1539 per B share in March 2002.
From the 2002 Chairman's letter (March 2003) no statement regarding increase in intrinsic value is found, but book value grew by 10%. Using 8% to 12% as upper and lower estimates results in $48880 to $51710/A share and $1629 to $1723 /B in March 2003.
From the 2003 Chairman's letter (March 2004) the more generic statement "Despite their shortcomings, book value calculations are useful at Berkshire as a slightly understated gauge for measuring the long-term rate of increase in our intrinsic value." Book value increased by 21%. Using 22-24% for increase in intrinsic value gives an IV-MOS estimate of $59633 to $64120/A and $1988 to $2137 /B for March 2004.
What about since then? As a WAG, I'll add 0.25%-0.5% per month to estimate IV gains till the next chairman's letter. This is roughly $150 to $300/month for A's and $5 to $10/month for B's. Thus, for February 2005, I get a range of $61283 to $67420/A and $2043 to $2247 /B. Remember this is a "fire sale" price that is so much below IV that even a tightwad like Buffett would spend shareholders' cash to buy back stock. It would represent a "back up the truck" opportunity.
For me, I'll look at buying more BRK below $75000 A/$2500 B; below $67500A/ $2250 B that beep-beep-beep is my truck in reverse; below $63000A/ $2100 B, its margin, home equity loans, hock the kids, put it all down on Buffett. Will we see these prices again? My view is that if other great companies can get put on sale in a market decline, so can BRK--I don't think it is any more immune to the vagaries of Mr. Market than any other publicly traded entity. I think the opportunity will present itself.
This Saturday, March 5 will be the release date of the 2004 Berkshire Annual Report and Chairman's letter. In all likelihood, some statement about intrinsic value/book value will be made, and I will update my assessment accordingly.
Warren Buffett, Richard Russell, and the Web
Chairman MaoXian had a great link the other day to notes from a Warren Buffett q and a with some Vanderbilt business students. These notes are all over the web--here, here and here. There's great stuff in there, everyone should read them and cogitate on them, and that's the way the web should work.
What's also interesting to me is that apparently, they also appeared here, in Richard Russell's $250/year newsletter. Now, Russell is a smart old guy who's been around forever and forgotten more about markets than Jaloti is likely to ever know. However, Russell lamented (and I quoted, here, back when only Trader Mike was reading me) that with the Internet giving stuff away for free, how could fee based newsletters survive? Again, with him putting non-origianl non-proprietary content in his newsletter that other people are giving away for free, the question is still relevant.
How, indeed?
Going from 90 to 100, and confirmation bias
There has been a very nice multi-blog discussion, started here by Random Roger, and advanced by Michael Taylor of Taylor Tree, as well as Anumati, about the Tom Dorsey idea that once a stock gets to 90, its a buy because it will continue to 100. (Arguably, Ugly foreshadowed this idea here.)
To recap, Roger put the idea on the table, quoting Dorsey. Michael looked at the numbers, and said, while it's a little difficult to get comprehensive data because of splits, etc, it appears to happen "only" 55-60% of the time. Anumati then said this makes it an example of confirmation bias. All true, but let me put the Jaloti spin on it.
If this were a simple 50/50 bet, i.e. goes to 100/doesn't go to 100, and the odds were 55-45, you'd take that bet all day long--right? The casinos make billions on tighter odds than that. What is really be asked with this one, is how long does it take to get from 90 to 100, AND what are the chances it goes to 0 first? The way to make money off of this one is to ask, once a stock hits 90, how often does it get to 100, before it gets to 80 (or 85, or whatever margin of safety you want, to pervert the value investors' catchphrase). If, for instance, there was good data over time that after 90, 55% go to 100 before they go to 85, I'd take that one in a heartbeat.
Cut your losers short, and let your winners run, right?
Random Roger makes me think
Loser List for February 28, 2005
ADAM-- nice chart, pullback in an uptrend, stop about 5.3, though volume is marginal.
BOOM-exploded out(sorry). If you're into breakouts, this is one, stop at the breakout--17.5
CALM--a short if it stays below 10.
DDDC--might be a buyable pullback above 4.2 or so.
EENC--breakout and pullback--long above 20.
IINT--long above 2.25
BGO--if gold's running, this one might, stop at 3
LAB might be a buyable pullback above 9.2
the Pennies--
MUCL--ok, that's it, the last time for this one--if it bounces off 0.40 its a buy with a stop at 0.38
CTCHC--if you have to buy a penny, this is as good as any--stop at 0.6
PMU--another on the penny list--long stop at 0.6
How to use this list. And what would it be without the disclaimer?
Sunday, February 27, 2005
Sunday Night Charts for February 27, 2005
I'm gonna mix it up a little bit.
But first let's start with an old favorite.
The US Dollar Index. Weekly chart.

Courtesy of stockcharts.com
Still a downtrend. Interestingly, it broke my trendline, and is sitting just above it, but then it has done this before.
Next is the XOI oil index
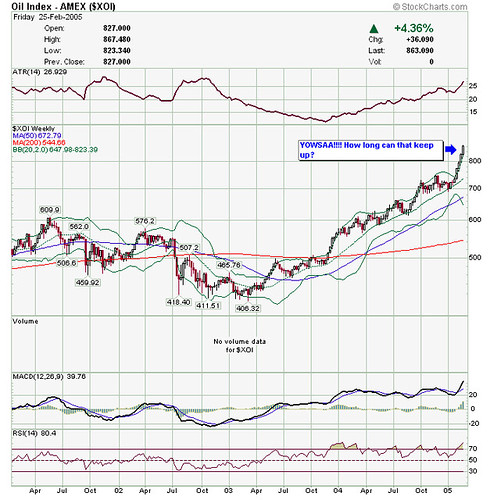
Courtesy of stockcharts.com
Bill Cara is calling this a melt-up top in the oils. Sure looks like it will come down, but when? Bill's a lot smarter at this stuff than I am, and he may well be right--but timing is everything--it may drop on Monday, or it may run another 15% and 15 days before it drops. "Markets can remain irrational longer than you can remain solvent." (John Maynard Keynes).
Next, a new one--the IYR (REIT iShares) Weekly
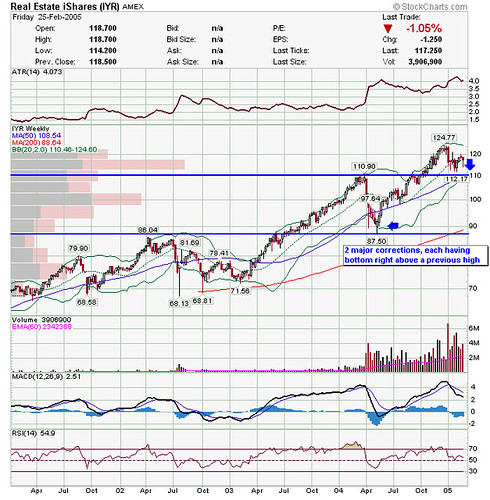
Courtesy of stockcharts.com
To me, looks like support at 110 from the previous high, and a lot of volume in the low 110s. (Although I'm less sure of what volume means in ETFs.) This makes it look like a buyable pullback in REITs.
But let's look at the monthly IYR chart.
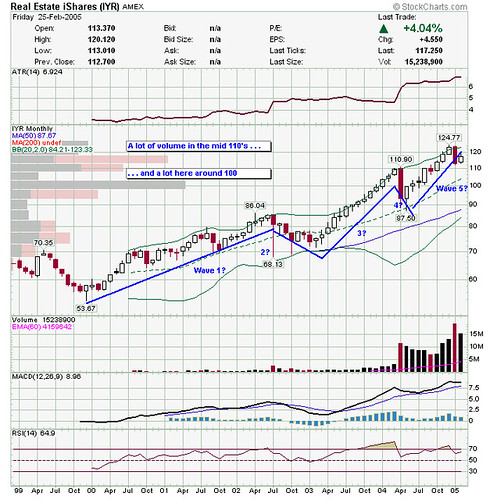
Courtesy of stockcharts.com
REITs have been running for a long time, is this Elliot's 5th wave? Perhaps not, if we can stay above 110? What's that saying, "A man with a watch knows what time it is, a man with two watches is never sure". Substitute "chart" for "watch" and that's me!
Have a great week everyone!
But first let's start with an old favorite.
The US Dollar Index. Weekly chart.
Courtesy of stockcharts.com
Still a downtrend. Interestingly, it broke my trendline, and is sitting just above it, but then it has done this before.
Next is the XOI oil index
Courtesy of stockcharts.com
Bill Cara is calling this a melt-up top in the oils. Sure looks like it will come down, but when? Bill's a lot smarter at this stuff than I am, and he may well be right--but timing is everything--it may drop on Monday, or it may run another 15% and 15 days before it drops. "Markets can remain irrational longer than you can remain solvent." (John Maynard Keynes).
Next, a new one--the IYR (REIT iShares) Weekly
Courtesy of stockcharts.com
To me, looks like support at 110 from the previous high, and a lot of volume in the low 110s. (Although I'm less sure of what volume means in ETFs.) This makes it look like a buyable pullback in REITs.
But let's look at the monthly IYR chart.
Courtesy of stockcharts.com
REITs have been running for a long time, is this Elliot's 5th wave? Perhaps not, if we can stay above 110? What's that saying, "A man with a watch knows what time it is, a man with two watches is never sure". Substitute "chart" for "watch" and that's me!
Have a great week everyone!
Roundtable stock--CMCSA
This weeks roundtable stock is CMCSA. Other roundtable members are Levi Bauer, Tom at Sixth World, Ron Sen, Bill Cara, and Kaushik Gala.
CMCSA has drawn a lot of interest lately with the news that Warren Buffett's Berkshire Hathaway has doubled its stake in the cable provider. A lot of people have been sort of scratching their heads, trying to figure out what the value angle is that the Sage of Omaha sees in Comcast. Let me end the suspense and give the answer at the end of this post;>).
First, I will offer a couple observations--1) A big chunk of Berkshire's equity portfolio is actually managed by Lou Simpson at Geico, with little/no input from Buffett. Simpson is no slouch himself as a stock picker, but the point is this may not be a Buffett pick per se. 2) Whether it is a Buffett pick or not, Buffett and Berkshire in the past have done very well with local newspapers and television stations--the Buffalo News, Washington Post, and Cap Cities/ABC. The thinking has been that these local media represent businesses with some sort of a "moat" --Buffett-speak for some sort of barrier, be it regulatory or whatever, to entry of competitors in the space. Cable television providers certainly fit into that category.
That having been said, Buffett has always maintained that you can't just buy a great business, you have to pay a good-to-great price for it. This is where the head scratching comes in, because any way you slice it, its hard to find the great valuation on CMCSA. The comparisons are a little difficult, since a lot of the broadcast/cable TV entities are privately held, but a quick review of the yahoo!finance stats shows a PE of 75 (!) compared to Echostar's 91 and the industry's 35, a P/Sales of 3.6 compared to Echostar's 2 and the industry's 1.7, and a PEG of 4, compared to Echostar's 2 and the industry's 2.5.
My summary of the fundies is that I don't see the screaming value here, but apparently somebody (Buffett and/or Simpson) a lot smarter than me does.
Now, let's look at the charts. As always, it depends on your time frame.
First, the daily charts, if you're looking for a swing trade of a few days duration.
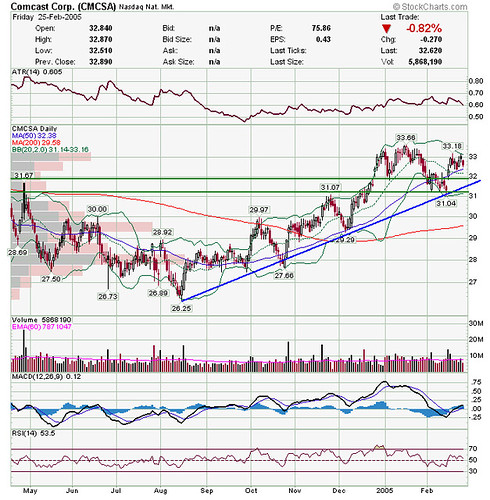
courtesy of stockcharts.com
Well, its a nice uptrend, I guess you could look for a swing trade a couple different ways. There is pretty good support at 32, from prior lows and the uptrend line, but there is resistance from the old highs at 33. I guess if it dropped to 32 and bounced, you could buy it on a tight stop, with an expected run to 33, so maybe you could squeeze a risk return of 3/1 out of it, but you'd have to be pretty nimble--that's really more of a day trade than a swing trade, frankly.
The other way to play this is to buy a breakout of the old high at 33.6. I think if you have to swing trade this one that's what I'd do. There are probably better plays out there.
Next let's look at the weekly chart.
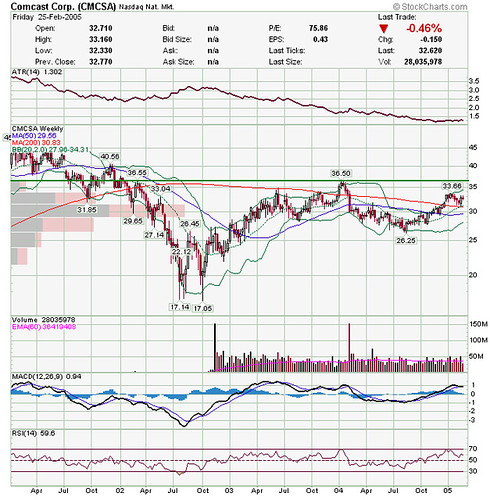
courtesy of stockcharts.com
Again, nothing terribly exciting. I think if you have to play it, the Gary B. Smith call would be to buy the breakout of the old high at 36.5, although there is a lot of resistance above that. Looking at the price by volume bars along the left side, you can see however that a lot of the outstanding volume traded around 30, so maybe there isn't a lot of supply in the high 30's. Still, nothing here that makes me eager to take a position.
Finally, the monthly chart, the one that Buffet and Simpson should be looking at :>)
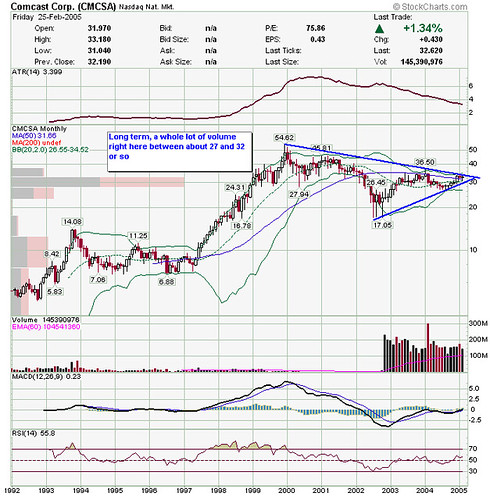
courtesy of stockcharts.com
Aha!! Now we have our answer! Clearly, Buffett and Simpson looked at this chart, saw the wedge and all the volume right around 30, and concluded when this one pops to the upside, it'll really run!
Isn't great to solve a mystery??!!???
(Uh, where's the sarcasm button on this thing?)
CMCSA has drawn a lot of interest lately with the news that Warren Buffett's Berkshire Hathaway has doubled its stake in the cable provider. A lot of people have been sort of scratching their heads, trying to figure out what the value angle is that the Sage of Omaha sees in Comcast. Let me end the suspense and give the answer at the end of this post;>).
First, I will offer a couple observations--1) A big chunk of Berkshire's equity portfolio is actually managed by Lou Simpson at Geico, with little/no input from Buffett. Simpson is no slouch himself as a stock picker, but the point is this may not be a Buffett pick per se. 2) Whether it is a Buffett pick or not, Buffett and Berkshire in the past have done very well with local newspapers and television stations--the Buffalo News, Washington Post, and Cap Cities/ABC. The thinking has been that these local media represent businesses with some sort of a "moat" --Buffett-speak for some sort of barrier, be it regulatory or whatever, to entry of competitors in the space. Cable television providers certainly fit into that category.
That having been said, Buffett has always maintained that you can't just buy a great business, you have to pay a good-to-great price for it. This is where the head scratching comes in, because any way you slice it, its hard to find the great valuation on CMCSA. The comparisons are a little difficult, since a lot of the broadcast/cable TV entities are privately held, but a quick review of the yahoo!finance stats shows a PE of 75 (!) compared to Echostar's 91 and the industry's 35, a P/Sales of 3.6 compared to Echostar's 2 and the industry's 1.7, and a PEG of 4, compared to Echostar's 2 and the industry's 2.5.
My summary of the fundies is that I don't see the screaming value here, but apparently somebody (Buffett and/or Simpson) a lot smarter than me does.
Now, let's look at the charts. As always, it depends on your time frame.
First, the daily charts, if you're looking for a swing trade of a few days duration.
courtesy of stockcharts.com
Well, its a nice uptrend, I guess you could look for a swing trade a couple different ways. There is pretty good support at 32, from prior lows and the uptrend line, but there is resistance from the old highs at 33. I guess if it dropped to 32 and bounced, you could buy it on a tight stop, with an expected run to 33, so maybe you could squeeze a risk return of 3/1 out of it, but you'd have to be pretty nimble--that's really more of a day trade than a swing trade, frankly.
The other way to play this is to buy a breakout of the old high at 33.6. I think if you have to swing trade this one that's what I'd do. There are probably better plays out there.
Next let's look at the weekly chart.
courtesy of stockcharts.com
Again, nothing terribly exciting. I think if you have to play it, the Gary B. Smith call would be to buy the breakout of the old high at 36.5, although there is a lot of resistance above that. Looking at the price by volume bars along the left side, you can see however that a lot of the outstanding volume traded around 30, so maybe there isn't a lot of supply in the high 30's. Still, nothing here that makes me eager to take a position.
Finally, the monthly chart, the one that Buffet and Simpson should be looking at :>)
courtesy of stockcharts.com
Aha!! Now we have our answer! Clearly, Buffett and Simpson looked at this chart, saw the wedge and all the volume right around 30, and concluded when this one pops to the upside, it'll really run!
Isn't great to solve a mystery??!!???
(Uh, where's the sarcasm button on this thing?)
Weekend Wazzup for February 27, 2005
My roundup of the Fox News Channel' s "Cost of Freedom" Saturday Morning shows-- is here. The Roundtable stock this weekend is CMCSA. Already weighing in on the Roundtable this weekend is Levi Bauer--other roundtable members are Tom at Sixth World, Ron Sen, Bill Cara, Kaushik Gala, and yours truly.
Congrats to Mr. and Mrs. Sixth World on their new arrival, Emily!
Ron Sen wins a prize again this week, with a total so far of 16 posts since yesterday morning. Lots of nice charts, some yada yada yada for Louise Yamada, and an admonition.
Bill Cara had, as he usually does, an outstanding review of the week. You'll want to set aside some time to read it but let me just throw out 2 nuggets--Bill says crude oil will see $35 before $55, and gold will go to $475.
Galatime reminded us again about the free subscriptions available to SFO magazine, as well as some earnings season options strategies on AEOS, SNY, COST, and PETM.
Random Roger had an interesting tidbit from Tom Dorsey, about how once a stock hits $90, its a good bet to get to $100. Micheal Taylor from Taylortree looked at the data--its an interesting exchange. Bottom line, its not a sure bet, but its better than 50/50.
Byrne at Marketview has been busy this weekend, commenting on everything from Social Security to Bono at the World Bank to the great Florida trailer bubble.
Stephen Castellano at Reflections on Equity Research--puts it right out there and says that Qwest will not acquire MCI. Gotta love it when somebody makes a call!
Ugly at uglychart has a bit on how to start your own stock market kung fu blog.
TraderMike had a nice little review of NVDA's chart as well as EBAY's and GOOG.
And last but not least is Chairman MaoXian, with a newsletter and his chat every weekday 8:30-9:30 Eastern time. Tell him ni hao!
And that's wazzup with my cyber-peeps for this weekend.
Saturday, February 26, 2005
Paging drgood--you were right and Jaloti was wrong
Back here on my loser list I mentioned a buying opportunity in the "canroys"--canadian oil and gas royalty trusts. Drgood commented by asking, essentially, isn't there a lot of downside risk in these since they will probably drop as interest rates rise? I responded by saying I always thought these were correlated more with the price of oil than with interest rates, but maybe I was wrong--I posted the charts and said look at the charts, maybe there is some correlation there, whaddya think?
The other day in the chairman's chat I mentioned I was looking at the correlations between the canroys, interest rates, and oil prices using "math". Let me say officially that I was wrong and Drgood was right. I'll give a few details below, but I looked at one canroy, PGH, and found a strong correlation with the price of treasuries, and in fact a little better correlation with the Nasdaq, for goodness' sake, than with the price of oil.
My method was fairly straightforward--I downloaded historical price data from stockcharts.com for PGH, the CBOT treasuries index, the West Texas Intemediate crude price, and the COMPQ.
I entered the numbers into my trusty Open Office spreadsheet (almost as good as excel, but the price is much better-"free"), and used the "R" correlation function. If you don't know what R is, it is essentially a measure of how 2 variables are correlated. If 2 variables are perfectly correlated, (e.g. one changes in exactly the same direction and ratio as the other), R would equal 1, if there was no correlation (e.g. two sets of random numbers) R would equal 0, and if they were perfectly negatively correlated (e.g. one moves in exactly the opposite direction--like bond prices and interest rates) R would equal -1. (If your smart in math/statistics you'll undoubtedly find flaws in my descriptions--if I am "materially misleading or incorrect" let me know. Aw heck, even if you want to nitpick let me know).
The results surprised me. Over the past 10 months, the correlation between PGH and treasuries was 0.8--that's pretty highly correlated. The correlation between PGH and the COMPQ was 0.66 and between PGH and WTI crude was 0.58. That's right--PGH was a little better correlated with the Nasdaq, than with crude. Over the past month, correlations were lower, but still better with treasuries than oil--PGH and treasuries was 0.57, and PGH and WTI was 0.47.
I intend to play around with these correlations a little more, but I have to say I am surprised, and hopefully I learned something. In the words of Alexander Elder--"I reserve the right to be smarter tomorrow than I am today." Thanks Drgood!
Friday, February 25, 2005
Request for Assistance
Assistance is needed from Jaloti's readers.
A doctoral candidate is interviewing financial blog readers for a research paper.
Any financial blog reader (that's you, if you're reading this) qualifies, but especially needed are readers under age 35, and female readers.
I was interviewed today, and rather enjoyed it, but then I enjoy just going on and on and on about myself, don't I . . .
Anyhow, if you are willing and able to be interviewed, please email me at harryjaloti@hotmail.com and I'll send your info along.
Another blog
Loser List for February 25, 2005
CULS a break out, but actually not by much; why do I get the feeling this one will fail?
CNC rising out of a pullback-- long, stop about 30.5- 31
DDDC Pull back, buy with a stop at 4.4
IINT if it shows strength, long with a stop at 2.3
TGA overbought, but if the gap holds above 8, this may be buyable.
LAB pullback in an uptrend, long with a stop at 9
For the "long term"-
ACAS may want to look at this on a fundie basis, might be a tradable pullback with a stop at 33-33.6
KO another long termer, I think 42 and change may well prove to be a good place to get into this one.
MFD nice long termer, good divy, pullback in an uptrend, buy around 20.5 or so.
The Pennies-
MUCL ?long with a stop about 0.4?
CTCHC how many days do I need to say it-a classic pullback with reduced volume. long with a stop about 0.55 -0.6
How to use this list. As always, read the disclaimer.
Thursday, February 24, 2005
Free Energy!! (essentially)
Props to the truck and barter boys for this one:
money quote:
Although expensive to build, solar towers "essentially produce energy for free," said Sherif [a University of Florida professor of mechanial and aerospace engineering].
The Jaloti corollary:
"Although expensive to buy and hang in your living room, a Picasso provides enjoyment and prestige essentially for free"
(I won't even bring up opportunity cost like T&B did . . . )
Loser List for February 24, 2005
MFLX Pullback--long with a stop at 20?
ACU Volume is a little low, maybe long with a stop at 16
ADAM long, with a stop at 5.5. Maybe
CTCHC a penny, long, stop at 0.6
GLOW if it show shows strength, long with a stop at 2
ISCA long, stop at 54
PLUM might be peachy above 5
NFI if 32-33 holds it might be time to get back in--if it doesn't then it isn't :>)
Wednesday, February 23, 2005
Update to the Loser List for Today
It should be CTIC--I've changed the original post to reflect that.
And I wasn't kidding about free gasoline with SUOG--check out the press release, about 2/3 of the way down.
And I wasn't kidding about free gasoline with SUOG--check out the press release, about 2/3 of the way down.
Loser List for February 23, 2005
No more gloating about being on the right side of gold, oil, and the dollar--it's all about what's happening now.
COMPQ looks like it could go to 2000.
SINA and SOHU gapped right to the 200d and pulled back-funny how that works
ASTM--bring back the fork
BOOM--interesting chart--is that a buyable gap up, or a failed test of top? I'm not sure, so I'm staying away; if you've got an edge here go for it.
ALEX one of my long term holds (they own a lot of Hawaiian real estate carried on the books at 50 year old prices) , nice uptrend, this may be a buyable pullback above 42.
CTIC still looking like a failed breakout. Short with a stop at 11
GLOW might be a buyable pullback--if it shows some strength, long with a stop about 2
LCBM--strong uptrend, some range contraction, long with a 16 stop?
Pennies--if you've got any spare change, you might look at one of these slot machines:
PMU --breaking out--stop at 0.6
MUCL might take a poke at this one, long, with a stop at 0.40
SUOG, long above 0.20 and free gas!
IINT if you've got anything left over, might go long if it shows strength, stop about 2.4
Read what this list is about and check out the disclaimer.
Tuesday, February 22, 2005
Floor traders 1, Greenpeace 0
What happens when you screw with raw capitalism:
http://www.timesonline.co.uk/article/0,,2-1487741,00.html
WHEN 35 Greenpeace protesters stormed the International Petroleum Exchange (IPE) yesterday they had planned the operation in great detail.
What they were not prepared for was the post-prandial aggression of oil traders who kicked and punched them back on to the pavement.
“We bit off more than we could chew. They were just Cockney barrow boy spivs. Total thugs,” one protester said, rubbing his bruised skull. “I’ve never seen anyone less amenable to listening to our point of view.”
Another said: “I took on a Texan Swat team at Esso last year and they were angels compared with this lot.” Behind him, on the balcony of the pub opposite the IPE, a bleary-eyed trader, pint in hand, yelled: “Sod off, Swampy.”
Don't you just hate . . .
. . . those pundits with selective memory who are always plugging their right calls and forgetting their wrong ones?
(sigh)I can't help it.
I'm one of them.
With today's moves in gold, oil, and the dollar, doesn't this Haiku look like I knew something?
Yeah, like a stopped clock knows something :>)
(sigh)I can't help it.
I'm one of them.
With today's moves in gold, oil, and the dollar, doesn't this Haiku look like I knew something?
Yeah, like a stopped clock knows something :>)
Loser List for February 22, 2005
Oil indices XOI and OIX look overextended and due for a correction, but when? If you're in the oils, trailing stop. If not in, wait for a pullback.
LENF --another BB, does range contraction ... at 5?
MFLX--if it shows some strength, it might be a buy with a stop at 22.
MUCL--if you've got beer money you don't need, take a flier with a stop at 0.40
ADAM buyable pullback stop at 6?
FFIV long stop at 51
NAT buyable pullback at 50?
PLUM--consolidating above 5, and maybe some of that range contraction stuff as well
TKF, long, stop 19
How to use this list. As always, read the disclaimer.
Monday, February 21, 2005
Just to show I'm not just a short term trader
Another one of those Top Performers lists--This is top 25 of 1994-2004.
http://www.thinkequity.com/blog/reports/topperformers.pdf
(note--I suspect #2 doesn't include the past couple months . . .)
1. APOL Apollo Group, Inc.
2. CREE Cree, Inc.
3. DRL Doral Financial Corp.
4. QCOM QUALCOMM, Inc.
5. SHFL Shuffle Master, Inc.
6. DHI D.R. Horton Inc.
7. AMHC American Healthways, Inc.
8. OSK Oshkosh Truck Corporation
9. WFMI Whole Foods Market, Inc.
10. SBUX Starbucks Corporation
11. SLM SLM Corporation
12. COF Capital One Financial Corp.
13. RYL The Ryland Group, Inc.
14. TECH Techne Corporation
15. EV Eaton Vance Corp.
16. HAR Harman International Industries Inc./DE/
17. TOL Toll Brothers, Inc.
18. MSCC Microsemi Corporation
19. CAI CACI International Inc
20. HARB Harbor Florida Bancshares, Inc.
21. NTY NBTY, Inc.
22. BZH Beazer Homes USA, Inc.
23. JKHY Jack Henry & Associates, Inc.
24. ZQK Quiksilver, Inc.
25. CDWC CDW Corporation
George Orwell and Blogging
The fact that a loser like me can just set up a blog and actually have people read it, got me to revisit a recurrent thought I've had--that George Orwell in 1984 got it half right and half wrong. Orwell's "negative utopia" had ubiquitous "telescreens", something he conceived of as a television set that could both receive and transmit; it could both feed you the government's line, and spy on how closely you were following it. With computers, laptops, web cameras, and everywhere internet access, we're basically there. What Eric Blair (Orwell's real name) couldn't quite see was that all this recieving and transmitting could go in many directions. Being a good socialist, he only saw the central planning model, where "the word" goes out from one location to all, and the return path is from all back to the central location. He didn't (apparently) envision telescreens that were peer-to-peer, to use the term loosely, where any one can see and talk to and write to any other one (or many other ones), where in fact this giant network of two-way telescreens that we call the internet lets us choose from a multiplicity of voices, not be forced to hear just one.
Yeah, ok, the markets need to open back up so I don't get too philosophical . . . .
Yeah, ok, the markets need to open back up so I don't get too philosophical . . . .
Interesting site and post
With the US markets closed today, it might be a good day to catch up on reading, etc. Check out Michael Taylor's TaylorTree site. He's got a lot of good stuff with some interesting insights. He made a comment on the move into electronic medical records and how QSII might benefit from that. He also linked to a fascinating interview of Bob Hoye from institutionaladvisors.com: "The world is long inflation and short the dollar." Definitely some "against the crowd" views there; it's worth the read.
Sunday, February 20, 2005
Sunday Night Charts for February 20, 2005
All weekly charts.
Let's start with a new one.
The Dow Jones Utility Average
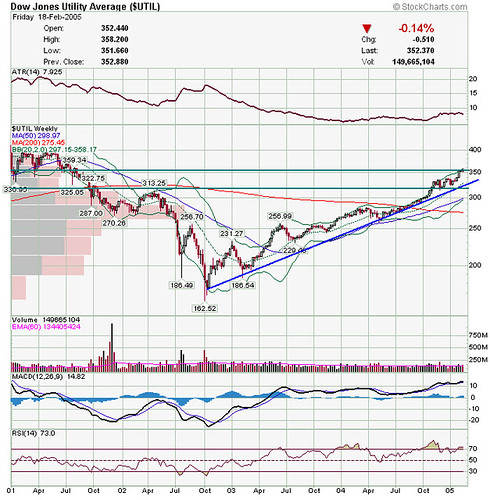
Courtesy of stockcharts.com
Trendline intact. Lots of support below based on volume and prior highs. Still a bull run.
Next is the Nasdaq Composite
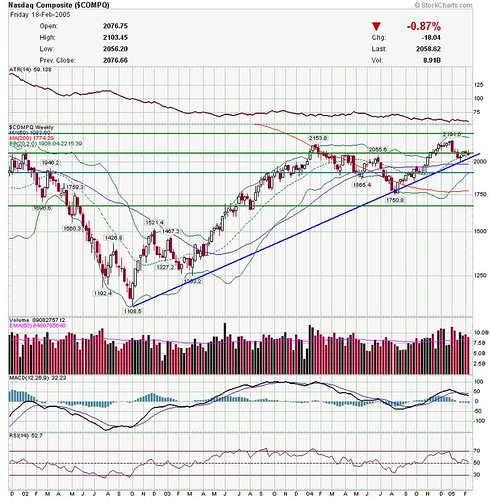
Courtesy of stockcharts.com
Despite the action of the past few weeks, the longer term trendline is still intact.
The CRB Weekly
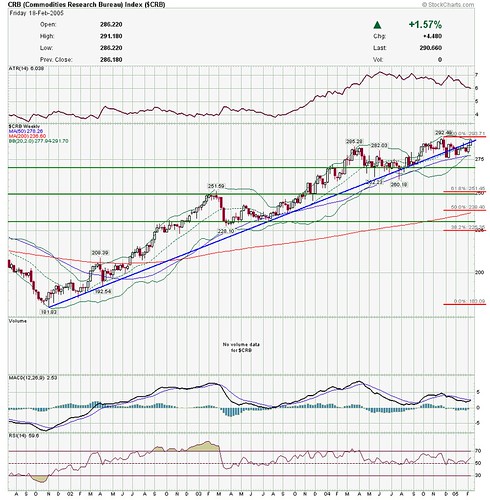
Courtesy of stockcharts.com
I worried here and here about the trend maybe being over, but it looks like temporary violation of the trendline may be reversed. Looks more like the bull is continuing than ending.
As confirmation of the CRB, here is the CME stock chart
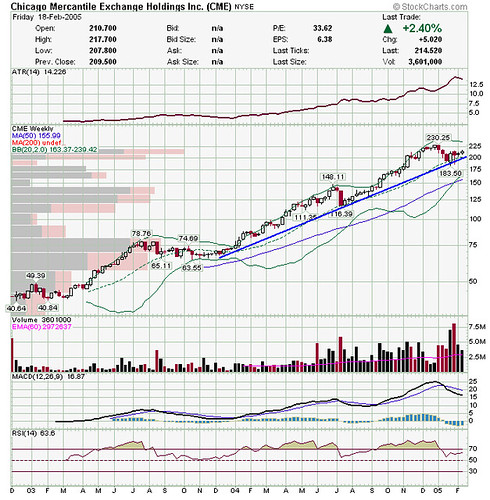
Courtesy of stockcharts.com
Despite a nasty gap down on the daily the other day, trendline is intact.
Here is Gold
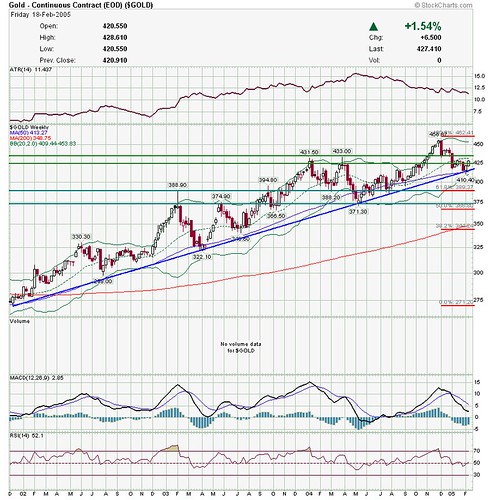
Courtesy of stockcharts.com
Again, the bull continues.
Next is West Texas Intermediate Crude (oil, that is, black gold, Texas Tea)
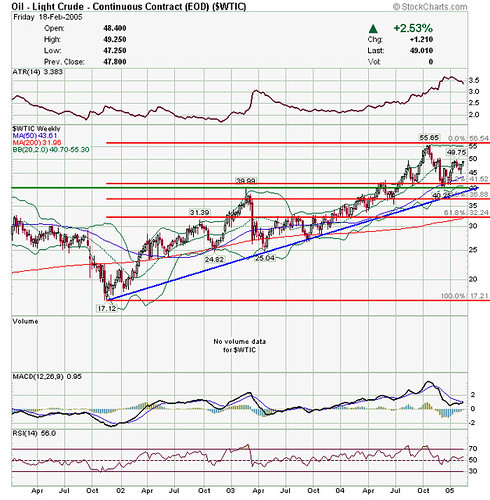
Courtesy of stockcharts.com
Not even really overextended.
However the Oil index, representing oil equities, is a little different story.
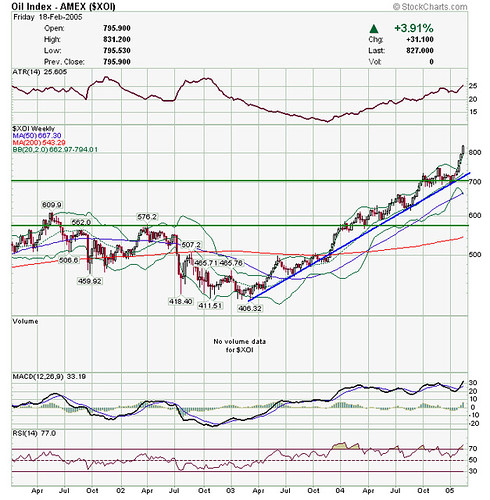
Courtesy of stockcharts.com
Definitely overbought, based on the RSI, the Bollinger Bands, the distance above the 50d and 200d, and probably any other criteria known to man. However, overbought can stay overbought for a long time. Additionally, check out late '04--same story, parabolic move up, overbought, but corrected not by dropping but by marching in place. Could the oil stocks correct from here--sure, but it may be by stagnating rather than dropping. It also may occur 10%, 20% above here. Thus, if you're in--trailing stop. If you're out, might want to wait and see.
Finally is the USD
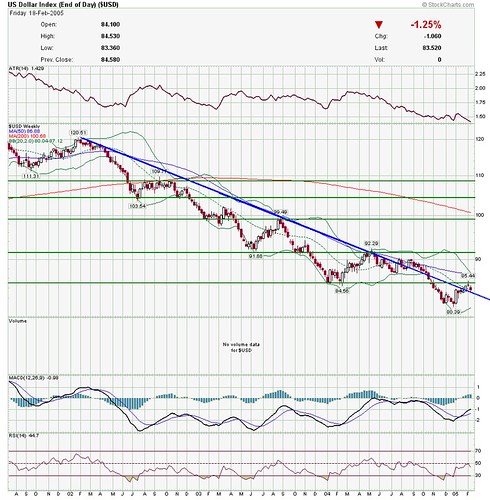
Courtesy of stockcharts.com
continuing its downtrend as I called here and here.
Good luck and have a great week!
Let's start with a new one.
The Dow Jones Utility Average
Courtesy of stockcharts.com
Trendline intact. Lots of support below based on volume and prior highs. Still a bull run.
Next is the Nasdaq Composite
Courtesy of stockcharts.com
Despite the action of the past few weeks, the longer term trendline is still intact.
The CRB Weekly
Courtesy of stockcharts.com
I worried here and here about the trend maybe being over, but it looks like temporary violation of the trendline may be reversed. Looks more like the bull is continuing than ending.
As confirmation of the CRB, here is the CME stock chart
Courtesy of stockcharts.com
Despite a nasty gap down on the daily the other day, trendline is intact.
Here is Gold
Courtesy of stockcharts.com
Again, the bull continues.
Next is West Texas Intermediate Crude (oil, that is, black gold, Texas Tea)
Courtesy of stockcharts.com
Not even really overextended.
However the Oil index, representing oil equities, is a little different story.
Courtesy of stockcharts.com
Definitely overbought, based on the RSI, the Bollinger Bands, the distance above the 50d and 200d, and probably any other criteria known to man. However, overbought can stay overbought for a long time. Additionally, check out late '04--same story, parabolic move up, overbought, but corrected not by dropping but by marching in place. Could the oil stocks correct from here--sure, but it may be by stagnating rather than dropping. It also may occur 10%, 20% above here. Thus, if you're in--trailing stop. If you're out, might want to wait and see.
Finally is the USD
Courtesy of stockcharts.com
continuing its downtrend as I called here and here.
Good luck and have a great week!
Weekend Wazzup for February 20, 2005
My roundup of the Fox News Channel' s "Cost of Freedom" Saturday Morning shows-- is here.
Weighing in on the Roundtable today are Tom at Sixth World, Ron Sen, Bill Cara, Kaushik Gala, Levi Bauer , and yours truly. The stock is AAPL, and I think everybody has some useful insights, even if we all pretty much came to the same conclusion.
Speaking of my roundtable brothers, it looks like Tom may have some big news soon. Good luck, Mr. and Mrs. Sixth World!
Ron Sen has changed the name of his blog to Technically Speaking. Ron, I don't care what you call it, it's still great stuff. He had a whole plethora of posts covering a wide range of topics, including many charts. He coined the best nickname this week: "Abby-normal Joseph Cohen."
Bill Cara had, as he usually does, an outstanding review of the week. I was somewhat surprised to see him on the same side of the LEXR trade as Tobin Smith. Maybe I need to look at that one.
Levi the Soothsayer of Omaha had what I consider a model of evaluating a stock--take a look at his review of AAPL.
Moving on and picking a name at random, Roger Nusbaum had a couple very insightful comments--one of them being a more in depth view of something I commented on as well. He also asks if a bell is ringing for Brazil, Russia, India and China. I said it before I'll say it again, I can always count on Roger for insights I don't get elsewhere.
Always providing insight is Chairman MaoXian, whose newsletter came out a day early this weekend. He's not taking more donations for it at this time, but he's still the man! ;>) Check out his chat every weekday 8:30-9:30 Eastern time.
Also check out Byrne's Marketview who has a couple observations on the Verizon-MCI deal.
CommodityTrader noted that the price of copper is nearing an all-time high. (Still hasn't done anything for my position in MKRR, though.)
Ugly at uglychart also weighs in with his view of AAPL. There has been some good natured back and forth about this. I was also interested to see his review of Shaolin Soccer, a movie that I enjoyed as well.
New on my list of blogs is Stephen Castellano at Reflections on Equity Research--he links to Jaloti, how bad can he be! ;>)
TraderMike has been quiet so far this weekend. He's probably busy reading the rest of us. :>)
Roundtable on AAPL
This week's Roundtable stock is AAPL. Joining me in evaluating it are Tom Ott, Kaushik Gala, Levi Bauer, Ron Sen, & Bill Cara. I try pretty hard not to look at my colleagues' evals before I write mine, because I don't want to bias myself. I have to confess this week I glanced at Levi's; frankly, after seeing it I'm tempted to write "just read Levi's write-up, I can't add anything intelligent to that"--he put together a disciplined, thorough, step by step comprehensive look at it that is just outstanding. Nevertheless, I'll try to say something semi-intelligent and vaguely appropriate.
Apple to me is one of those "cult" companies and products. There are fanatics who think Apple's products are "genius", and who think Jobs is a visionary pioneer, and then there are people like me who say, "yeah, that's kinda cool, but Dell makes pretty much the same thing cheaper, and Whizbango makes something similar for a whole lot cheaper."
If this sounds derogatory, I apologize; I don't mean it that way--what I really mean to say is that I just don't get it, it being Apple's products or the company. To me computers become more and more of a commodity every year, and why one product or one company deserves a premium is unclear to me. However, just because I don't "get" something doesn't mean it can't work.
Right now it does look like Apple the stock is commanding a premium compared to other computer manufacturers. It sports a PE of 70, compared to Dell's 30, and the industry average of 24, and a PS of 3.6, compared to Dell's 2 and the industry's 1.5. Yeah, but its a fast grower right now, you say--except that its PEG ratio is 2, compared to Dell's1.1 and the industry's 1.3. Now, I know this is just a cursory look at simple numbers, but sometimes you don't have to put the fat person on a fancy scale to know that he's fat. I don't see any way to call this company a "buy" on a fundamental basis--the time to do that was late '02-early '03 when it was priced in the low teens and, as I recall, had 12 bucks per share in cash. Of course, then there were rumblings that Apple was "over" (that's always the way it is, isn't it?).
Let's look at some technicals. I think those are a pretty simple stratightforward story as well.
Here is the weekly chart for AAPL
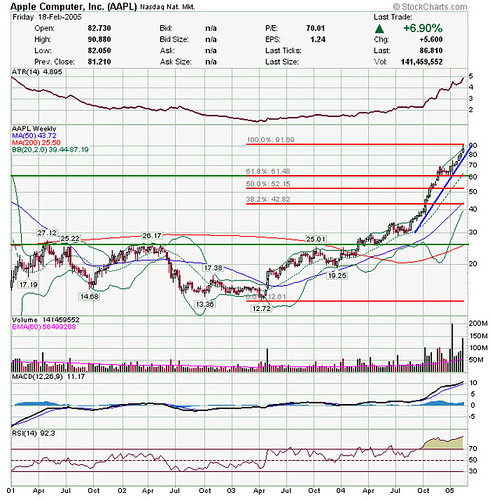
courtesy of stockcharts.com
While it certainly has come real far real fast, I wouldn't short it--its come this far, who's to say it can't go up another 20,30,50, or even 100 points? When a stock has risen like this, I think it's a coin flip as to whether the next 20-30 points will be up or down. Thus, I have no edge in picking the direction here. I will say that a simple glance at the chart shows me support at 60, from the consolidation there, and the fibonacci retracement. If we get a pullback to about 60, and then some strength again, one could justify going long again with a stop just below 60.
The money quote: Any way you look at this one, it's expensive. If you're lucky enough to be in this one from a lot lower, two words: trailing stop. If you're not in this one, I'd stay out. I wouldn't do anything till after a significant correction.
Apple to me is one of those "cult" companies and products. There are fanatics who think Apple's products are "genius", and who think Jobs is a visionary pioneer, and then there are people like me who say, "yeah, that's kinda cool, but Dell makes pretty much the same thing cheaper, and Whizbango makes something similar for a whole lot cheaper."
If this sounds derogatory, I apologize; I don't mean it that way--what I really mean to say is that I just don't get it, it being Apple's products or the company. To me computers become more and more of a commodity every year, and why one product or one company deserves a premium is unclear to me. However, just because I don't "get" something doesn't mean it can't work.
Right now it does look like Apple the stock is commanding a premium compared to other computer manufacturers. It sports a PE of 70, compared to Dell's 30, and the industry average of 24, and a PS of 3.6, compared to Dell's 2 and the industry's 1.5. Yeah, but its a fast grower right now, you say--except that its PEG ratio is 2, compared to Dell's1.1 and the industry's 1.3. Now, I know this is just a cursory look at simple numbers, but sometimes you don't have to put the fat person on a fancy scale to know that he's fat. I don't see any way to call this company a "buy" on a fundamental basis--the time to do that was late '02-early '03 when it was priced in the low teens and, as I recall, had 12 bucks per share in cash. Of course, then there were rumblings that Apple was "over" (that's always the way it is, isn't it?).
Let's look at some technicals. I think those are a pretty simple stratightforward story as well.
Here is the weekly chart for AAPL
courtesy of stockcharts.com
While it certainly has come real far real fast, I wouldn't short it--its come this far, who's to say it can't go up another 20,30,50, or even 100 points? When a stock has risen like this, I think it's a coin flip as to whether the next 20-30 points will be up or down. Thus, I have no edge in picking the direction here. I will say that a simple glance at the chart shows me support at 60, from the consolidation there, and the fibonacci retracement. If we get a pullback to about 60, and then some strength again, one could justify going long again with a stop just below 60.
The money quote: Any way you look at this one, it's expensive. If you're lucky enough to be in this one from a lot lower, two words: trailing stop. If you're not in this one, I'd stay out. I wouldn't do anything till after a significant correction.
Saturday, February 19, 2005
Fox Saturday Morning "Business Bloc" for February 19, 2005
Fox News Channel' s "Cost of Freedom" Saturday Morning shows--
All four shows had a lot of the usual pointless back and forth macro talk--housing- is it a bubble, is tech coming or going, etc. A lot of this seems to be the same-old same-old every week, so I basically ignore most of it unless there is some unusual insight (rare) and concentrate on the specific stock mentions.
Bulls and Bears
Had a "Scoreboard" segment which was a review of guests' previous picks, good and bad. The two most interesting things in this segment were 1) they generally only talk about stocks with a market cap greater than 500 million on this show, so they had to make exceptions for KKD and LEXR; and 2) nobody said anything about a stop loss being important in the case of some of these bad picks. As for specifics, Tobin Smith scored with picking MSO but now says sell it; also had picked LEXR (loser) but said he's buying it again(he said it has $2 in cash per share). Scott Bleier had a winner with LSS and currently says hold it; his big loser was GNSS. Perma-bull Joe Battipaglia picked NMGa which he says is still a hold but he had said avoid EK which subsequently racked up some gains.(Kinda ironic that the perma-bull's "avoid" pick was a winner.) Pat Dorsey picked NOK which he called still a hold but had picked KKD last May(he said he missed some warning signs). Gary Kaltbaum had a winner in MAR (still a hold) but a loser in LLY.
In the predictions segment Tobin Smith called for a test of the Nasdaq bottom and then a rally, Joe Battipaglia said buy SGP and BMY, Pat Dorsey liked DV and Gary Kaltbaum said MSFT will sink.
Cavuto
Lots of pointless macro talk but this interesting exchange in regard to the housing bubble question-- Ben Stein said there is a shortage of home inventory in Southern California, and Jim Rogers compared that to when the pundits said there was a shortage of stock in 1968, right at the top. Next was a segment on how well C, TYC, TWX have done since scandals and bad news. Rogers says buy ABB and short FNM and the homebuilders but Charles Payne says go long FNM. (Insert your favorite comment about it takes two sides to make a market) Payne also recommended RHI.
Forbes on Fox
Had a rather non-specific discussion about whether cable companies or phone companies were a better buy. Mentioned as a speculative buy was CHTR , as a possible takeover was CMCSA, also mentioned was VZ, supposedly cheap at 13x earnings.
Cashin In
Wayne Rogers says oil, gas and natural resources are still strong and he mentioned PKZ, PTR, BR, VLO, BHP saying he owns them all. He also mentioned TSRA. Jonathan Hoenig says utilites and reinsureance are the trends he sees. As usual he managed to mention a number of tickers he owns in passing: PBR E COP BP XOM RD. (In case it isn't clear I appreciate this--I watch these shows to get specific stocks to look into). His featured pick was Brazilian utility ELP and he also mentioned SBS CPL CIG. When he was challenged that their dividends were realtively low, he said he owns them for the capital appreciation more than the divys. Danielle Hughes picked ERICY and said she owns it. Jonas Max Ferris picked BCS, in part because he believes them to be in the running to manage private social security accounts. Wayne Rogers liked the stock and said it has a great website. Ferris also picked ANPI as a speculation for drug coated stents--he's looking for a surprise on earnings next week.
Friday, February 18, 2005
Thanks
I'd just like to take a moment to thank everyone who's sent a tip, everyone who's sent an email, or posted a comment and especially everyone who's just stopped by and looked at a page or two on my site. I started this effort as a way to just get my thoughts and plans down in black and white as a way to help me in my trading; I continue to be pleasantly surprised, gratified and flattered that so many people actually are reading what I write.
I'm going to keep writing, and I hope y'all keep reading.
Thanks again.
I'm going to keep writing, and I hope y'all keep reading.
Thanks again.
TA vs. FA
Byrne had a thought provoking post about Technical Analysis. He certainly is pretty open minded about it for a fundamentals guy. I sorta agree and sorta disagree with him though. Money quote: "One of the crucial differences between fundamentals and technicals in this respect is that fundamental analysis is about taking a lot of data and applying a few rules, whereas technical analysis involves a little data (prices and volume) and a lot of rules. "
Certainly, TA only uses price and volume as data--everything else is derived from that. As for a lot of rules, I think that depends on the implementation. Certainly there are a lot of rules out there, but I'm not sure that the successful use of TA depends on using a lot of them--in fact quite the contrary; I think the more successful TA traders use only a few simple rules.
He also said, "However, most of what it (technical analysis) offers is the same thing fundamental analysis offers: Confidence. I'll go out on a limb and hypothesize that whether or not there's any real science behind the discipline of picking stocks, people who are confident that they're right (and can admit it when they're wrong) will do better than the rest." Mostly, I agree with this--especially with the "can admit it when they're wrong" part. I think an essential component of any successful approach is that you pick some criteria by which your thesis will be proven wrong, and set up a contingency plan for what you will do then (i.e., close your position).
In my view what makes TA useful is that to, some degree, EVERYBODY trades on price. The Warren Buffetts of the world say, I'm buying KO below 40 and not a penny more--so the technician says the volume coming in and every dip below 40 get pushed back up to form a nice hammer or whatever you're calling the formation(support). The average Joe trader says I'm underwater on INTC, so everytime it gets back to my entry point at 24, I'm gonna sell and use the money for table dances (note, NOT a work-safe link) and booze. This shows up on the chart as well(resistance.) Oversimplified, but you get the idea.
A little housekeeping about the Loser List
Every day I post the "Loser List". I give it this name because I call myself Just Another Loser On The Internet. This is a list that I work off of to make trades, based mostly on technicals. Usually, I am looking at something that is trending, has moved against the trend ("pulled back", if in an uptrend), and is now resuming its trend. (Otherwise known as "buying strength on weakness" or "selling weakness on strength".)My time frame is nearly always at least a couple days, and sometimes much longer.
It certainly is not a recommendation to buy or sell, because, after all, if you remember from the disclaimer, I am not a registered investment advisor and thus could not make such recommendations. Obviously, anybody has to due their own due diligence and look at all the factors that might be important to them in buying or selling a stock. So, take the names you see on my list, and use them as a starting point for your own evaluation. Or maybe you should just fade me, that might be a plan . . . ;>)
It certainly is not a recommendation to buy or sell, because, after all, if you remember from the disclaimer, I am not a registered investment advisor and thus could not make such recommendations. Obviously, anybody has to due their own due diligence and look at all the factors that might be important to them in buying or selling a stock. So, take the names you see on my list, and use them as a starting point for your own evaluation. Or maybe you should just fade me, that might be a plan . . . ;>)
MSFT shows its m4d sk1llz
Very interesting to see article at Microsoft.com on l33t ( pronounced "leet"in case you didn't know), also known as "hackz0r" or "h4kz0r" ("hack-sore"). If you didn't know what the kids these days are up to, this is a bit of an introduction. It did sort of remind me a bit of my parents' generation passing information to each other about what us kids were up to ("Marijuana is referred to by many names: maryjane, hash, reefer, pot, stash, lid, key") of course, they would get the syntax wrong, and leave out the latest names. There always seems to be an element of "those kids have their own lingo to hide their shenanigans from us" and that's probably true. Frankly (and to get semi-serious for only a minute I promise) as the parent of a teenager I worry very little about what he does on the internet; with only a few exceptions (writing viruses, etc.) they don't get into trouble or run into harm on the net, its when they leave the net and go out into the real world and get wasted, drive cars, play grab-ass and try to get into each other's pants that the real trouble happens.
The more time they spend on the net calling each other "n00b" and discussing their "m4d sk1lz", the less time they have to get into real trouble.
The more time they spend on the net calling each other "n00b" and discussing their "m4d sk1lz", the less time they have to get into real trouble.
Loser List for February 18, 2005
ADAM--buyable dip?- stop at 5.5
DDDC-buyable pullback? stop at 5
CTIC fake out break out? (thanks makin) short below 10?
GTEL--want to play a BB penny--buy the pullback, stop at 0.25--or you could spend the money on booze, it'd probably be more rewarding
CTCHC--another penny, stop at 0.65
PMU--penny breaking but--if it gets above the 200day at 0.64, might be worth picking up a couple shares
ASTM --gotta hold 3, or the fork gets stuck in it(again).
Thursday, February 17, 2005
a comment and my reply
DrGood commented on my post, asking whether the Canadian oil/gas royalty income trusts PGH, PVX,PWI aren't dangerous in a rising interest rate environment. My initial response was, I don't think so, because I'd always assumed that these high dividend payers (they're currently paying around 14% or so, though some of this is return of capital, since they are depleting assets) are correlated with the price of oil, not interest rates. But then I thought, hey, maybe I'm wrong (I am Just Another Loser on The Internet, after all) and maybe they will act more like preferred stocks and bonds and fall in price as rates rise.
So I looked at some charts on stockcharts.com. Let me simply line up the weekly price charts of PVX, the CBOT treasury index, and West Texas Intermediate Crude.
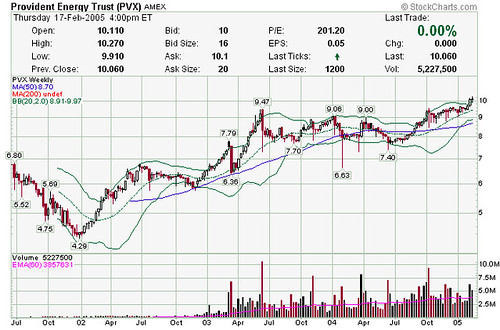
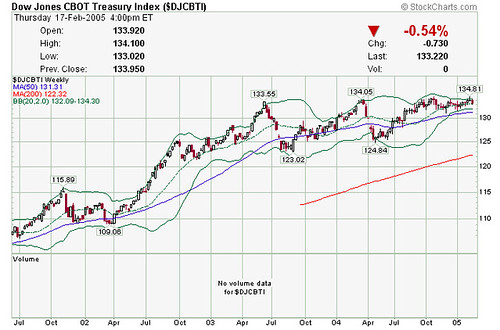
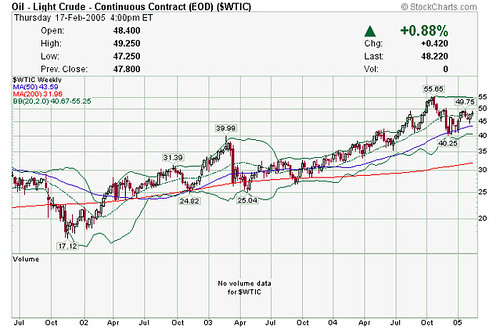
courtesy of stockcharts.com
Look and judge for yourself.
Maybe there is a bit more of a correlation with interest rates than I would have thought--look at the fall in treasuries in June-July 03 and the slide in PVX at the same time. Of course, Treasuries slid again in Apr 04, and PVX didn't change much.Surprising to me is that the correlation with crude prices is not as good as I might have thought, just by eyeballing it. Let me know what ya'll think.
So I looked at some charts on stockcharts.com. Let me simply line up the weekly price charts of PVX, the CBOT treasury index, and West Texas Intermediate Crude.
courtesy of stockcharts.com
Look and judge for yourself.
Maybe there is a bit more of a correlation with interest rates than I would have thought--look at the fall in treasuries in June-July 03 and the slide in PVX at the same time. Of course, Treasuries slid again in Apr 04, and PVX didn't change much.Surprising to me is that the correlation with crude prices is not as good as I might have thought, just by eyeballing it. Let me know what ya'll think.
Loser List for February 17, 2005
The resistance levels I identified on gold and the naz seemed to have held. I predict they will hold until they don't.
MUCL another penny breaks out--and Ron Sen is ashamed to admit he is long from about 0.17--way to go Ron.
ALGN still keep an eye out for a short below 9
ASTM may well have put in a short term bottom at 2.5--once it crosses 3, resistance is at 3.8
NAT if you want to "buy strength on weakness", now is your chance here, at 51 with a stop at 49-50
NDAQ--the poor man's CME-buy the whole friggen' nasdaq for 10 bucks
OCR -short- overhead resistance is at 32.5
PLUM consolidating above 5, does range contraction . . .?
VGZ-long with a stop at 3.68
CGREF if you're going to trade a penny stock with 7K daily volumes, this is as good as any. Long with a stop at 1.55
The canroys, PGH, PWI, and PVX all found dip buyers yesterday including jaloti
Wait. . .
Where's my disclaimer?
Wednesday, February 16, 2005
The speed of light is too slow
Material Change links to an interesting article claiming exactly that.
(I think this is my best article title since this one.)
(I think this is my best article title since this one.)
"Beaten, ----ed, and driven from the land"
I love the yahoo finance boards. What makes this post really special is that the words are those of the CEO of Overstock.com.
For more on the story, read the other posts in the thread.
For more on the story, read the other posts in the thread.
Loser List for February 16, 2005
ALGN--might be time to short again, with a stop about 9
ASTM--wait, take out the fork!!Long and strong, until it crosses 2.5, then stick the fork back in!
CTCHC--five letters, a nice chart, and at 67 cents it's cheaper than a lottery ticket. What more do you want?
PMU--only three letters, but even cheaper at 60 cents. Buy a couple shares, what have you got to lose?!
CULS--the costco of American Samoa is a buy above 9.
DCTH support at 3 on this one.
NVTL nice entry point for a short with a stop about 14
TZOO--its still long above 50 and short below, but now range contraction is followed by ...
VGZ--nice little pullback, long if it stays above 3.75
CNR--pulled back, and there seem to be buyers in the mid 1.30s
Wait for the beep, listen to the disclaimer . . .
Tuesday, February 15, 2005
No big whup
Just a couple charts
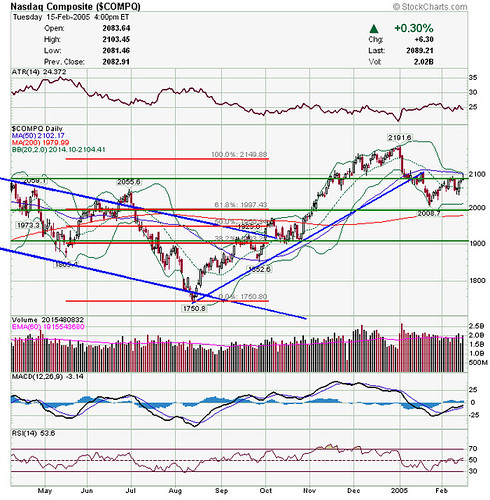
courtesy of stockcharts.com
The COMPQ is at 2089--I've had 2090 marked as major S/R for a while
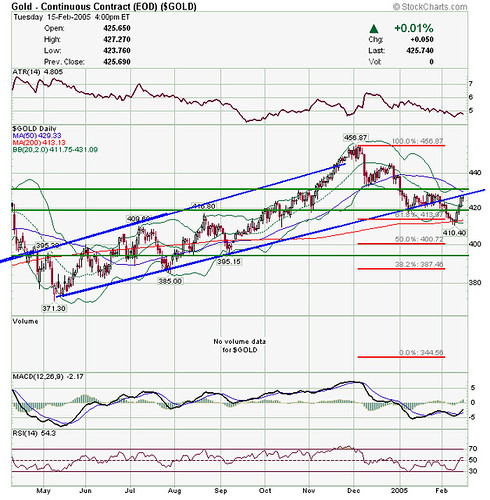
courtesy of stockcharts.com
GOLD on the daily broke thru the uptrend at the end of January--and now it's come up to that line from underneath. Next?
courtesy of stockcharts.com
The COMPQ is at 2089--I've had 2090 marked as major S/R for a while
courtesy of stockcharts.com
GOLD on the daily broke thru the uptrend at the end of January--and now it's come up to that line from underneath. Next?
Loser List for February 15, 2005
CTCHC and PMU--if you want undadultered pure mo-mo penny stock plays, here they are--place your bets!
MERQ maybe a long above 46.5
PLUM consolidating for the next move up?
RMCF--breakout, then pullback--stop at 17-17.5
ASTM--stick a fork in it?
SYMC--risen back to resistance--short with a stop above 22.5??
TEAM--this chart keeps drawing me in but DON'T DO IT THE VOLUME IS TOO LOW!! (Sorry, I'm ok now)
TZOO--if 50 doesn't hold, look out below
KBH still looks like a good long entry above 110-112
KKD is going to zero.
Monday, February 14, 2005
A beautiful chart
Time to short the dollar again . . .
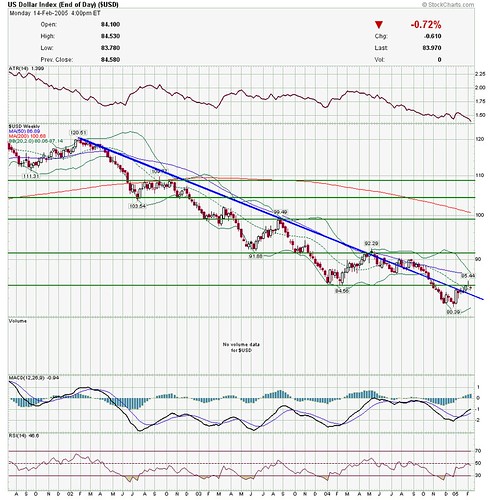
courtesy of stockcharts.com
Rises to the level of the previous major low, and falls again.
A thing of beauty.
courtesy of stockcharts.com
Rises to the level of the previous major low, and falls again.
A thing of beauty.

Loser List for February 14, 2005
ADAM may be a buy above 5
AFFX might have found support at 40
ALDN looks like a sell below 22.5, buy above 25
ARBA if you really have to catch a falling knife, you might try to buy this with a stop below 7.5
ASR--pullback after a breakout, maybe buy above 29 with a stop below 28
AVB if it can't get above 70, a short?
BEBE pullback after a breakout--buy, stop about 27.5
CENT is breaking out-- if you buy those, buy this
DCTH--if it shows a little strength here, might be a buy with a stop below 3
DDDC breakout above 6.
HANS uptrend, looks to have pulled back to support. Might be a buy with a stop at 37
ISCA a solid breakout above 55
OCR might be a short below 32
TINY gapped up and may have resumed the uptrend. Stop below 13.5
TZOO 50 looks to be the line in the sand here--Buy above, sell below?
WCG long and strong--as long as its above 35
AOC--maybe Spitzer's dogs have been called off--looks strong above 25.
KBH--don't fight the homebuilders--looks like a pullback to support at 110.
Has MRK put in a bottom? If your gonna buy, stop at 28 if you're short term, or 25 if you're longer term.
NFI has been a falling knife--and a lot of buyers caught it between 31 and 33--that may provide some support. But it's still a falling knife.
SU has broken out to new highs above 37. Since it has large fields of oil sands that are only profitable if oil stays above 25-30$ a barrel, do the buyers have a specific opinion on oil, as well?
Sunday, February 13, 2005
Sunday Night Charts for 2/13/05
Tonight I want to focus on commodity charts. Though my long term view is that of a commidiites bull, I have been a bit of a Nervous Nellie lately, wondering if the bull might be faltering.
First lets look at the weekly chart of the CRB.
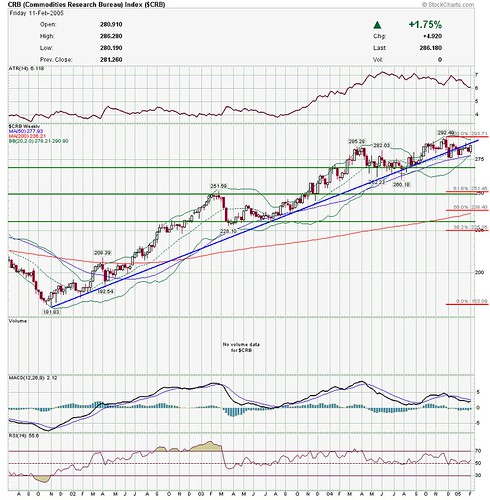
courtesy of stockcharts.com
Yeah, its cracked the uptrend line, and rose back to meet it underneath. Its crunch time--will it bounce off the uptrend line and head down, to confirm breaking it, and will it rise above the uptrend line again, making this just a fake-out uptrend violation? Tune in next week--at any rate, I wouldn't commit big bucks in new money either way.
Next let's look at the weekly chart of GOLD
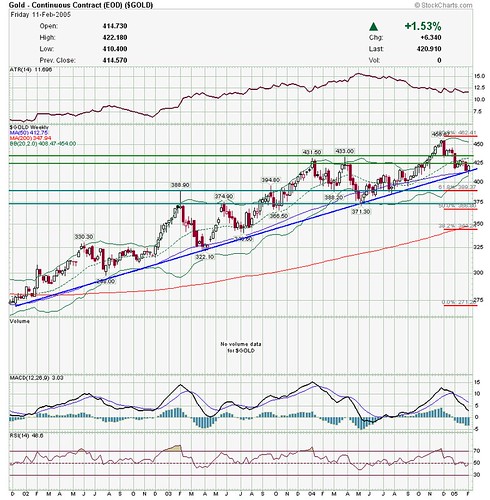
courtesy of stockcharts.com
As many times before, nice bounce off the uptrend line--the technicals say perhaps a good buying opportunity in the yellow metal.
Now let's look at OIL -- West Texas Intermediate Crude
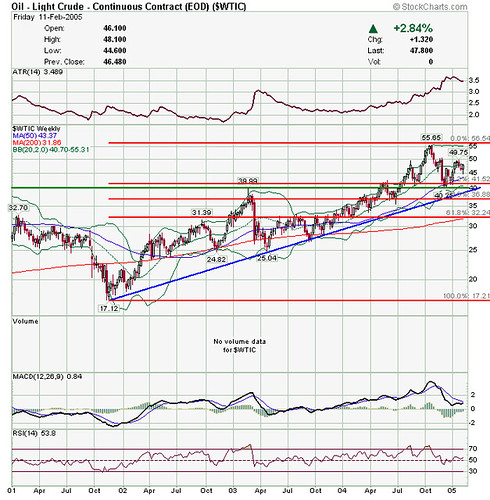
courtesy of stockcharts.com
Bit of a pullback, but still solidly in an uptrend. Don't fight black gold.
Finally lets look at CME weekly chart.
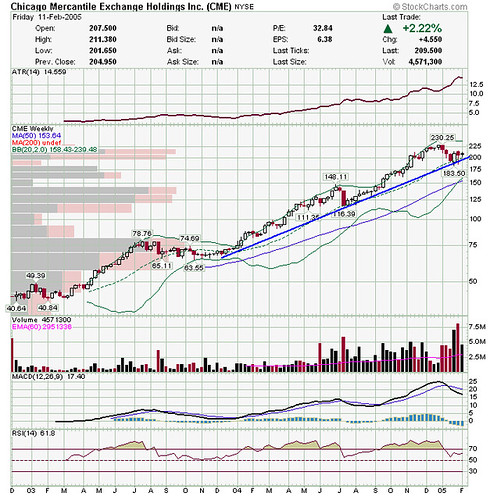
courtesy of stockcharts.com
Bit of a scare there, but the long-term uptrend is still in place.
My conclusion--don't sell commodities yet, and at least in the case of gold and oil, this may be a buying opportunity.
Remember the Alamo--and the disclaimer.
First lets look at the weekly chart of the CRB.
courtesy of stockcharts.com
Yeah, its cracked the uptrend line, and rose back to meet it underneath. Its crunch time--will it bounce off the uptrend line and head down, to confirm breaking it, and will it rise above the uptrend line again, making this just a fake-out uptrend violation? Tune in next week--at any rate, I wouldn't commit big bucks in new money either way.
Next let's look at the weekly chart of GOLD
courtesy of stockcharts.com
As many times before, nice bounce off the uptrend line--the technicals say perhaps a good buying opportunity in the yellow metal.
Now let's look at OIL -- West Texas Intermediate Crude
courtesy of stockcharts.com
Bit of a pullback, but still solidly in an uptrend. Don't fight black gold.
Finally lets look at CME weekly chart.
courtesy of stockcharts.com
Bit of a scare there, but the long-term uptrend is still in place.
My conclusion--don't sell commodities yet, and at least in the case of gold and oil, this may be a buying opportunity.
Remember the Alamo--and the disclaimer.
Sixth World's Roundtable--fundies
As promised, a quick take on the fundamentals of TM and A.
Again, also weighing in are Kaushik Gala, Ron Sen ,Levi Bauer and of course, Thomas Ott at Sixth World.
Somebody (Peter Lynch, maybe?) says that there are no extra points given for "degree of difficulty" in analyzing stocks--the complicated stories don't necessarily make you any more money than the simple ones. Somebody else (John Train, I believe, but I can't swear to it) once said that the auto industry was one of the great capital destroyers of modern industry--GM and F, over the past half-century, actually have had to consume capital in the form of constantly issuing new stock in order to stay alive. With that background in mind, let's look at some simple metrics on TM.
Price to sales is 0.74, which in the abstract sounds cheap, but it compares to 0.14 for F, 0.11 for GM, 0.6 for HMC, and 0.53 for the industry as a whole. Similarly, TM's PE is 11, compared to 7 for F, 5 for GM, and 10 for HMC, 15 for the industry as a whole. No screaming value here. Is Toyota a great company? No doubt--my wife drives a Sienna, and it has more room inside than my Ford Expedition, which is a larger, more expensive, and less fuel efficient vehicle. No one could argue that Toyota's products aren't among the best. But the way to make money on the stock of a great company is to buy it at a good price, and my brief take on it is that it's not cheap here.
As for Agilent, same sort of thing. Its PE is 33, compared to 24 for IBM and 23 for the industry as a whole. PS is 1.58, with IBM at 1.63 and the industry at 1.22. PEG, or price to earnings to growth (I know, some people swear by this metric and some people swear at it) is 1.62 for A, 1.66 for IBM and 1.3 for the industry. Again no screaming value here.
In summary, I don't see any great value here based on the fundies. Maybe Kaushik, Ron ,Levi or Tom will be able to demonstrate some value, and I bow to their wisdom. But for old Jaloti, I'd stick to trading the technicals on both of these, buying a breakout of the trading range and/or selling a breakdown.
Sixth World's Roundtable
This week's Roundtable stocks are Toyota (TM) and Agilent Technologies (A). Also weighing in are Kaushik Gala, Ron Sen ,Levi Bauer and of course, Thomas Ott at Sixth World.
In this post I'll take a look at some technicals on each of these stocks. I'm taking a little longer term perspective on these, so I'll be using weekly charts. As a little background, I tend to be pretty simplistic with regard to looking at technicals--I'm just not smart enough to put together twenty different charts and indicators, and besides, when I try to do that I lose money faster. Generally for me its one chart, a little price, a little volume, some highs/lows and a trend line or two.
From a technical perspective, to me these stocks do have something in common--the Chairman's bromide, "Range contraction is followed by range expansion."
First, Toyota--again, weekly chart.
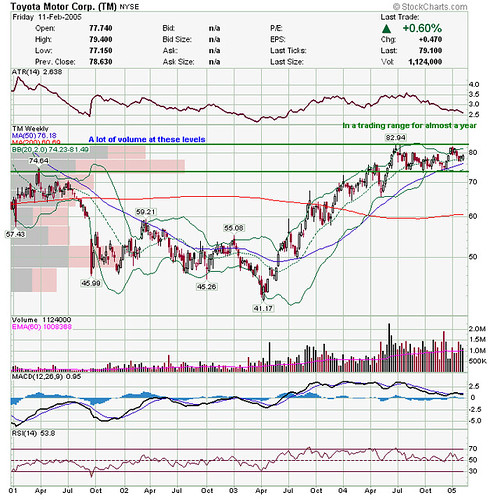
courtesy of stockcharts.com
I've noted the trading range for the past 9 months or so between about 74 and 82. That's a pretty tight range. Additionally, you can see the long price by volume bars for that range, meaning a lot of the volume in the stock over the past 4 years has been in that range. I see this as additional "fuel" to accelerate a move outside the range--less supply of stock at prices above 82 or below 74. One other point is that the bottom of this range is at an old high from three years ago, perhaps providing additional support. So from a long term technical standpoint, I'd be interested in buying a breakout above 82 and selling a breakdown below 74. In between, I'd let the shorter term traders take the points.
Next is the Agilent weekly chart.
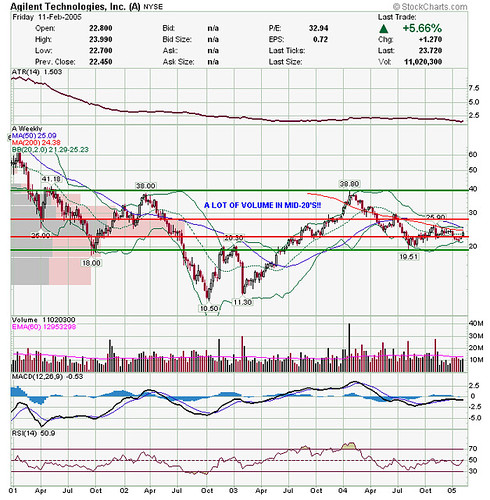
courtesy of stockcharts.com
Again, a tight trading range between about 20 and 30 for the past 9 months or so, and again, looking at the price by volume bars, a LOT of volume really between about 22 and 28 or so. Purely by the technicals, I'd be more tempted to sell a breakdown in the teens, and buy a breakout above 30.
Gala had an options play on A here.
I'll make at least a brief comment about the fundamentals a little later.
In this post I'll take a look at some technicals on each of these stocks. I'm taking a little longer term perspective on these, so I'll be using weekly charts. As a little background, I tend to be pretty simplistic with regard to looking at technicals--I'm just not smart enough to put together twenty different charts and indicators, and besides, when I try to do that I lose money faster. Generally for me its one chart, a little price, a little volume, some highs/lows and a trend line or two.
From a technical perspective, to me these stocks do have something in common--the Chairman's bromide, "Range contraction is followed by range expansion."
First, Toyota--again, weekly chart.
courtesy of stockcharts.com
I've noted the trading range for the past 9 months or so between about 74 and 82. That's a pretty tight range. Additionally, you can see the long price by volume bars for that range, meaning a lot of the volume in the stock over the past 4 years has been in that range. I see this as additional "fuel" to accelerate a move outside the range--less supply of stock at prices above 82 or below 74. One other point is that the bottom of this range is at an old high from three years ago, perhaps providing additional support. So from a long term technical standpoint, I'd be interested in buying a breakout above 82 and selling a breakdown below 74. In between, I'd let the shorter term traders take the points.
Next is the Agilent weekly chart.
courtesy of stockcharts.com
Again, a tight trading range between about 20 and 30 for the past 9 months or so, and again, looking at the price by volume bars, a LOT of volume really between about 22 and 28 or so. Purely by the technicals, I'd be more tempted to sell a breakdown in the teens, and buy a breakout above 30.
Gala had an options play on A here.
I'll make at least a brief comment about the fundamentals a little later.
Weekend Wazzup for February 13, 2005
My roundup of the Fox News Channel' s "Cost of Freedom" Saturday Morning shows-- is here.
On the net, Random Roger had a different take on Bill Cara's review of ETFs. (Insert comment about it takes two sides to make a market here.) Roger also has his perspective on Bill O'Neill's 8% stop loss rule.
Speaking of Bill Cara, he has his usual thorough review of the week, and makes a couple option recommendations on SNDK and AAPL.
Also making option recommendations is GalaTime who reviewed his trade in DELL that is doing pretty well. Keep an eye on his option plays, he's had some really good ones.
Heavy on the specifics as well as the big picture is Ron Sen who started the weekend quoting Ringo Starr(I've always liked that song), and then moved on to a series of interesting looking charts. This morning he posted his section of the Roundtable on TM.
The Roundtable continues with Tom at Sixth World posting his thoughts on TM. Also to be weighing in on the Roundtable today (besides the aforementioned Kaushik Gala and Ron Sen are Levi Bauer and yours truly.
Speaking of Levi the Soothsayer of Omaha, he had a nice position sizing exercise worth reading.
Always worth reading is Chairman MaoXian's newsletter, which is out now. Slip him a little something to get it, and tell him Jaloti is the man! ;>) Check out his chat every weekday 8:30-9:30 Eastern time.
Also check out Byrne's Marketview who catches us up with Joe Granville(what a blast from the past).
Ugly chart had a nice and relevant quote from Adaptation.
And least but definitely not least is The Man, TraderMike who channels Alan Farley and quotes Gary Kaltbaum, and comments that all the hammers on Thursday have changed shorts to longs.
That's wazzup with my peeps. See you monday!
Saturday, February 12, 2005
Tufte Redux
Way back here I posted my review of design maven Edward Tufte's day long course. I mentioned sparklines, a kind of embedded-in-text graphics he talked about and said I would post examples. I intended at that time to scan in and post some examples he gave out, strangely enough of his proposal for using sparklines in stock/mutual fund tables. I decided there might be some copyright issues, so I won't post his, but I created a simple example of my own to illustrate his concept.
Basically, that's all there is to it. The idea really is to include graphics right in with the text--like smileys ;>)
Basically, that's all there is to it. The idea really is to include graphics right in with the text--like smileys ;>)
Friday, February 11, 2005
Another blog on my list
Added a new blog to my list: Byrne's Marketview. The commentary looks excellent, and the lagniappe was seeing the Ayn Rand, Hayek, and Dave Barry books on the profile.
Loser List for February 11, 2005
At the risk of being premature, let me ring the bell and call "Gold, short term bottom, dollar short term top"
ACU--filled in the gap, might be a buy above 17
ADAM--may have pulled back to support, buy with a stop at 5
AFFX--might have found support at 40. Buy with a stop there.
PENN still a nice uptrend--might be an entry point here with a stop about 65
PLUM--still looks peachy with a stop below 5
PNRA has pulled back--if 48 holds as support it looks good.
There still is no I in TEAM, and no volume either--but its a nice breakout.
TGA, baby, still long and strong with a stop below 6.
TONS may have given an entry, with a stop at 74
TZOO-below 50 would be the time to short, if you like shorting breakdowns(and who doesn't?). WCG--maybe support at 35?
CNR maybe an entry point in this one with a stop about 1.3
Miners like NXG,RGLD,RIC,MNG, NEM,NAK, VGZ all showing some strength--although it is a pretty V-shaped. Dead cat bounce, or start of a new sustained move??( I guess that's a matter of timeframe)
Don't forget the disclaimer . . .
Thursday, February 10, 2005
"Random" thoughts on Commodities, China, and Memes
Random Roger (as he often does) had an interesting observation the other day about commodities. He referenced a Jim Rogers quote to the effect that one can't be a good investor without understanding commodities. Roger makes the point that the supply and demand factors in commodities are important to understand, and that much of the recent strength in equities likely has something to do with commodity factors. My long term view has been that we would see continued strength in commodities, although of late I have questioned this. Certainly, there has been some weakness, and I think the next week or two will give us a good idea of whether commodities (ex-oil, which still is nothing but strong) are finished for now or whether the bull continues.
Taking it a step further, there has been a lot of talk that much of the strength in commodities has been due to the economic awakening in China. You can easily find a lot of statistics about the boom there-the equivalent of a city the size of Houston is built there every year, there are 4 times as many cars in 2004 compared to 1994, etc. However, this has become so commonplace an idea as to become a meme, and when something is so widespread everybody knows it, I wonder if it isn't over.
Fade the memes. Sounds like it could be a meme, eh?
Gold miners, jaloti and Bill Cara
I see Bill Cara is calling this morning to buy some gold miners. I said here that it looked like some of them may have put in a bottom. Now somebody who knows what they're talking about has said it too.
Loser List for February 10, 2005
ALGN- short on a break of 7.5
DCTH--has pulled back to 3--maybe a buy on a tight stop?
DESC--similarly, buy with a stop below 3.5
TEAM still looks like a buy above 11--darned low volume though
I'm in that TGA with a stop below 6.
WCG--this may be an entry point with a stop below 35
The gold miners from yesterday (BGO,MNG,RGLD) may indeed have put in bottoms-- but what's the timeframe?
LVLT down big, on huge volume--this stock has come back from the dead so many times I've lost count. Can it bounce again?
As always, you know . . .
Wednesday, February 09, 2005
Disciplined Growth Investors
New 13F from Disciplined Growth Investors. How can that not be a solid money management team--they're DISCIPLINED Growth Investors, for goodness sakes'.
Loser List for February 9, 2005
My biggest question is how low can that VIX go?
ACU stay with it long and strong above 19.
ACXM may be setting up a nice short with a stop above 23.5-24
ARBA was mentioned here; so far the technician was more correct than the fundamentalist.
OSTK looks like a short with a stop around 54-55.
Is PLUM finally looking peachy? Long and strong, as long as its above 5.
RIG--nice uptrend, but as always, entry point?
TASR--I think you could flip a coin as to which way this is going next.
TEAM--looks like a pullback after a breakout, if you're into stocks that trade 34K shares per day.
***TGA this is my play of the day. (Kiss of death). I plan to go long with a stop below 6--you probably ought to short it ;>)
ALEX has been in a nice long uptrend, and this may be a nice entry point, with a stop about 44.5
BGO might have found a bottom at 2.5. Or not.RGLD, NXG, MNG may also have found bottoms yesterday.
Quick, Watson. . .the disclaimer!
Tuesday, February 08, 2005
Loser List for February 8, 2005
ACU--if it holds above that gap at about 19 looks like a long.
AVB--ran smack into resistance at 70. Short?
BEBE-breakout, if it can hold 29, may get some follow through.
CREE--Tom at sixth world and I have gone back and forth on this one--may have found support at 23, but realistically, there is probably too much chance of more downside.
ISCA--breaking out to new highs, but not very convincingly. Perhaps range contraction precedes range expansion?
LCBM--pause after a breakout? More upside coming?
NVEC--gotta figure the percentages favor the next move being down.
PENN--beautiful uptrend. Check it out if you haven't. Not sure about an entry point, though.
There is no "I" in TEAM, but there is a "U" in SUCK. (Sorry, TEAM is on the list but volume is awfully low--and there is no SUCK.)
TONS of steel, and tons of money if you've held since 20(not me). Nice chart, but again, entry??
Remember the disclaimer. Have a good day.
Subscribe to:
Posts (Atom)