First lets look at the weekly chart of the CRB.
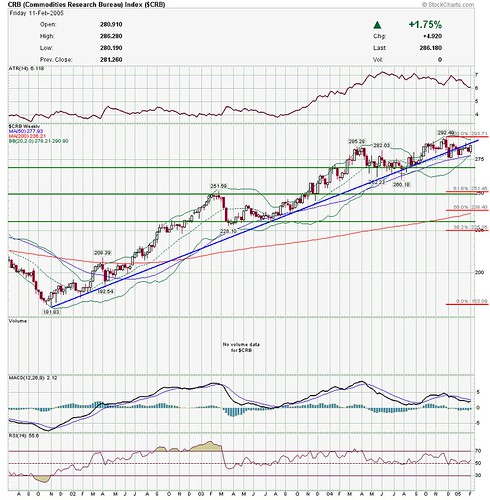
courtesy of stockcharts.com
Yeah, its cracked the uptrend line, and rose back to meet it underneath. Its crunch time--will it bounce off the uptrend line and head down, to confirm breaking it, and will it rise above the uptrend line again, making this just a fake-out uptrend violation? Tune in next week--at any rate, I wouldn't commit big bucks in new money either way.
Next let's look at the weekly chart of GOLD
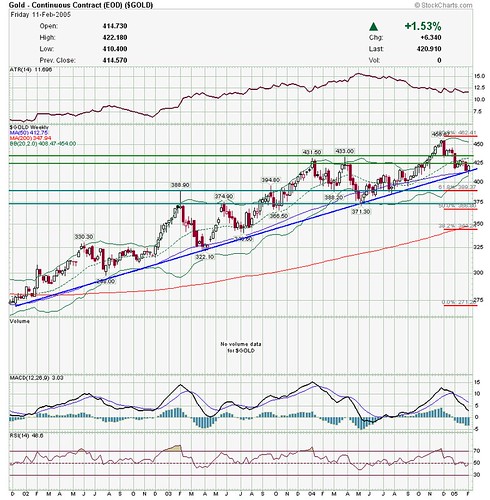
courtesy of stockcharts.com
As many times before, nice bounce off the uptrend line--the technicals say perhaps a good buying opportunity in the yellow metal.
Now let's look at OIL -- West Texas Intermediate Crude
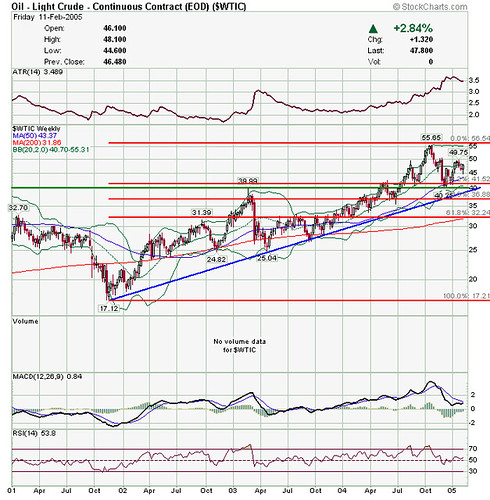
courtesy of stockcharts.com
Bit of a pullback, but still solidly in an uptrend. Don't fight black gold.
Finally lets look at CME weekly chart.
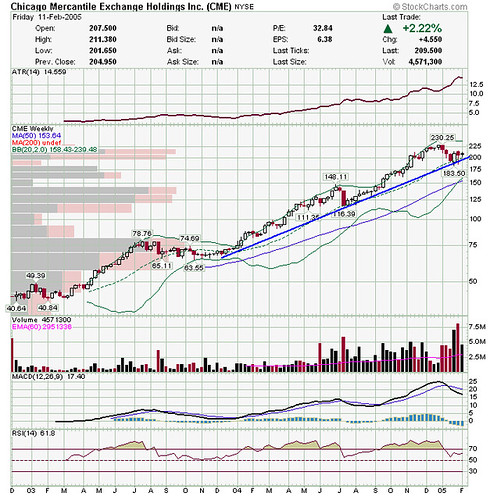
courtesy of stockcharts.com
Bit of a scare there, but the long-term uptrend is still in place.
My conclusion--don't sell commodities yet, and at least in the case of gold and oil, this may be a buying opportunity.
Remember the Alamo--and the disclaimer.
No comments:
Post a Comment