Let's start with a new one.
The Dow Jones Utility Average
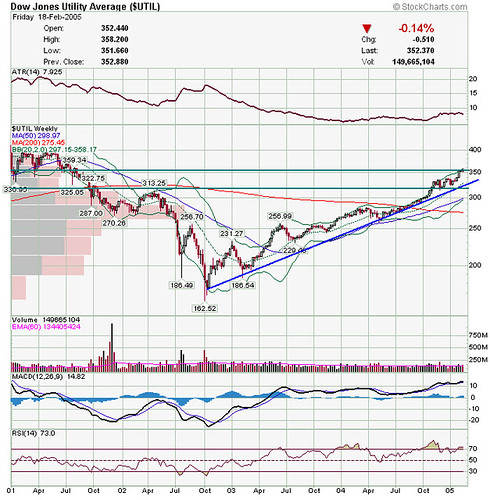
Courtesy of stockcharts.com
Trendline intact. Lots of support below based on volume and prior highs. Still a bull run.
Next is the Nasdaq Composite
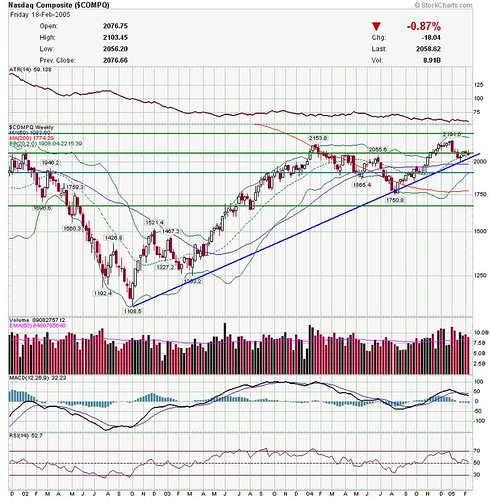
Courtesy of stockcharts.com
Despite the action of the past few weeks, the longer term trendline is still intact.
The CRB Weekly
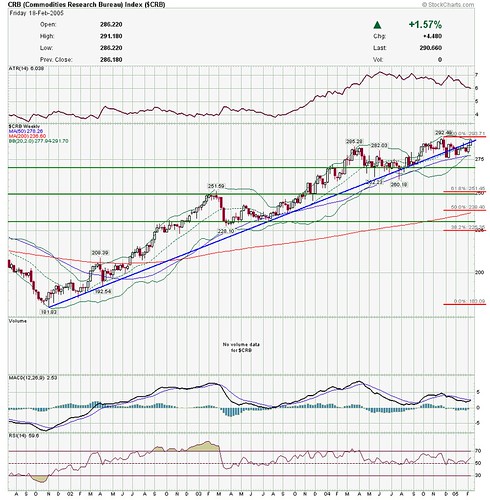
Courtesy of stockcharts.com
I worried here and here about the trend maybe being over, but it looks like temporary violation of the trendline may be reversed. Looks more like the bull is continuing than ending.
As confirmation of the CRB, here is the CME stock chart
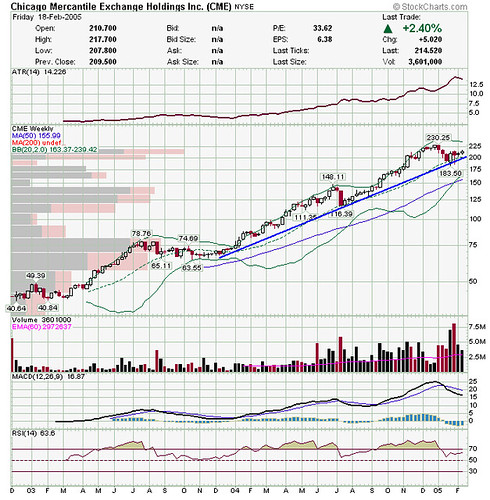
Courtesy of stockcharts.com
Despite a nasty gap down on the daily the other day, trendline is intact.
Here is Gold
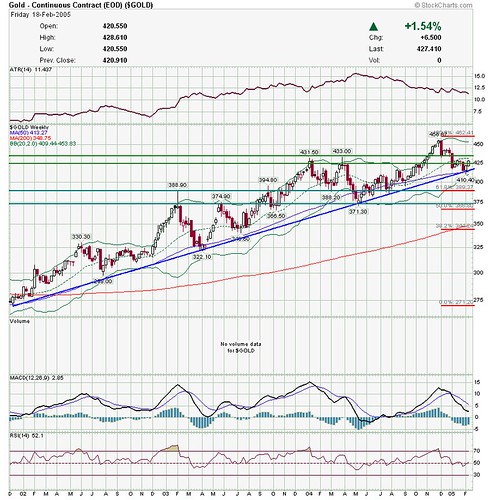
Courtesy of stockcharts.com
Again, the bull continues.
Next is West Texas Intermediate Crude (oil, that is, black gold, Texas Tea)
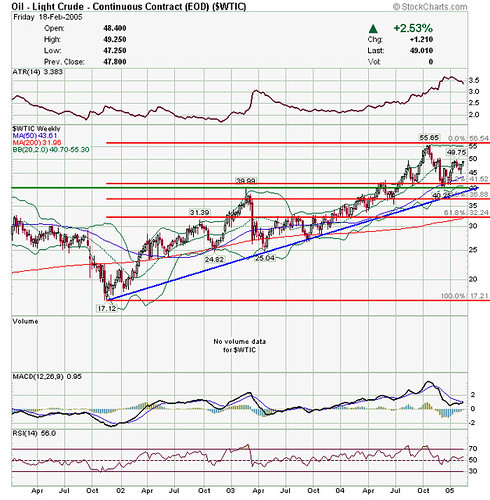
Courtesy of stockcharts.com
Not even really overextended.
However the Oil index, representing oil equities, is a little different story.
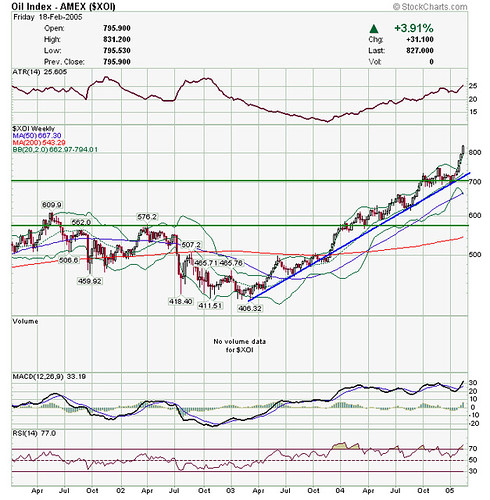
Courtesy of stockcharts.com
Definitely overbought, based on the RSI, the Bollinger Bands, the distance above the 50d and 200d, and probably any other criteria known to man. However, overbought can stay overbought for a long time. Additionally, check out late '04--same story, parabolic move up, overbought, but corrected not by dropping but by marching in place. Could the oil stocks correct from here--sure, but it may be by stagnating rather than dropping. It also may occur 10%, 20% above here. Thus, if you're in--trailing stop. If you're out, might want to wait and see.
Finally is the USD
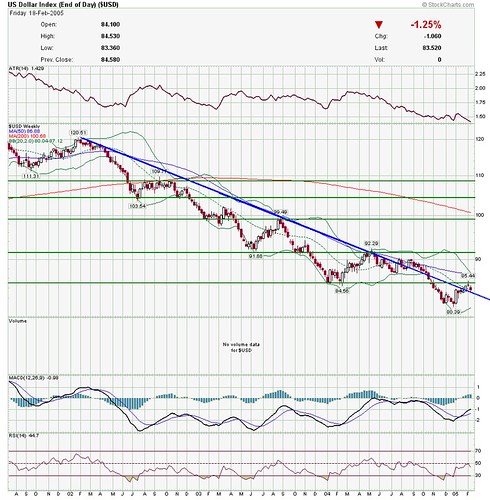
Courtesy of stockcharts.com
continuing its downtrend as I called here and here.
Good luck and have a great week!
No comments:
Post a Comment