CMCSA has drawn a lot of interest lately with the news that Warren Buffett's Berkshire Hathaway has doubled its stake in the cable provider. A lot of people have been sort of scratching their heads, trying to figure out what the value angle is that the Sage of Omaha sees in Comcast. Let me end the suspense and give the answer at the end of this post;>).
First, I will offer a couple observations--1) A big chunk of Berkshire's equity portfolio is actually managed by Lou Simpson at Geico, with little/no input from Buffett. Simpson is no slouch himself as a stock picker, but the point is this may not be a Buffett pick per se. 2) Whether it is a Buffett pick or not, Buffett and Berkshire in the past have done very well with local newspapers and television stations--the Buffalo News, Washington Post, and Cap Cities/ABC. The thinking has been that these local media represent businesses with some sort of a "moat" --Buffett-speak for some sort of barrier, be it regulatory or whatever, to entry of competitors in the space. Cable television providers certainly fit into that category.
That having been said, Buffett has always maintained that you can't just buy a great business, you have to pay a good-to-great price for it. This is where the head scratching comes in, because any way you slice it, its hard to find the great valuation on CMCSA. The comparisons are a little difficult, since a lot of the broadcast/cable TV entities are privately held, but a quick review of the yahoo!finance stats shows a PE of 75 (!) compared to Echostar's 91 and the industry's 35, a P/Sales of 3.6 compared to Echostar's 2 and the industry's 1.7, and a PEG of 4, compared to Echostar's 2 and the industry's 2.5.
My summary of the fundies is that I don't see the screaming value here, but apparently somebody (Buffett and/or Simpson) a lot smarter than me does.
Now, let's look at the charts. As always, it depends on your time frame.
First, the daily charts, if you're looking for a swing trade of a few days duration.

courtesy of stockcharts.com
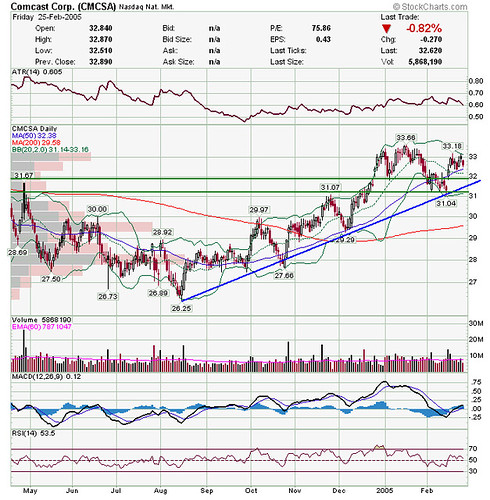
Well, its a nice uptrend, I guess you could look for a swing trade a couple different ways. There is pretty good support at 32, from prior lows and the uptrend line, but there is resistance from the old highs at 33. I guess if it dropped to 32 and bounced, you could buy it on a tight stop, with an expected run to 33, so maybe you could squeeze a risk return of 3/1 out of it, but you'd have to be pretty nimble--that's really more of a day trade than a swing trade, frankly.
The other way to play this is to buy a breakout of the old high at 33.6. I think if you have to swing trade this one that's what I'd do. There are probably better plays out there.
Next let's look at the weekly chart.

courtesy of stockcharts.com
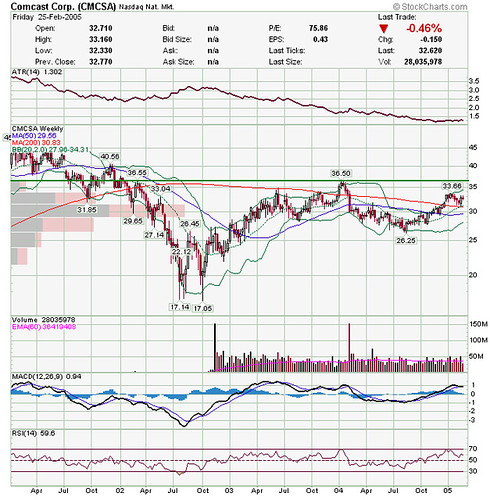
Again, nothing terribly exciting. I think if you have to play it, the Gary B. Smith call would be to buy the breakout of the old high at 36.5, although there is a lot of resistance above that. Looking at the price by volume bars along the left side, you can see however that a lot of the outstanding volume traded around 30, so maybe there isn't a lot of supply in the high 30's. Still, nothing here that makes me eager to take a position.
Finally, the monthly chart, the one that Buffet and Simpson should be looking at :>)

courtesy of stockcharts.com
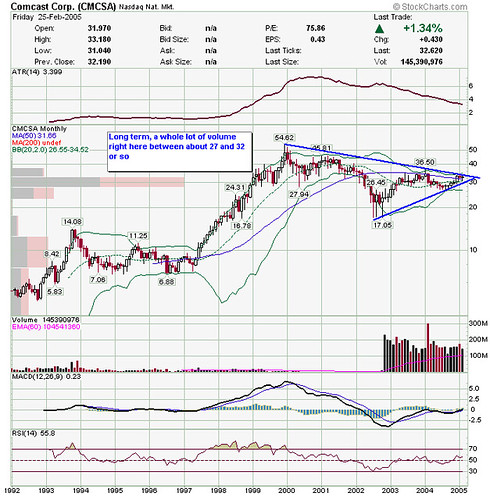
Aha!! Now we have our answer! Clearly, Buffett and Simpson looked at this chart, saw the wedge and all the volume right around 30, and concluded when this one pops to the upside, it'll really run!
Isn't great to solve a mystery??!!???
(Uh, where's the sarcasm button on this thing?)
No comments:
Post a Comment