I'm going to try to set back and look at a little bigger picture tonight.
First the Nasdaq. This is a weekly chart of the COMPQ.
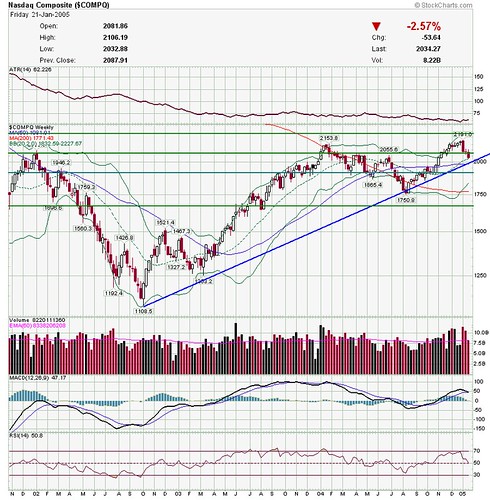
courtesy of stockcharts.com
There is a long term uptrend since fall 02 that is still in place, barely. If this uptrend line doesn't hold (and let's face it, where exactly this line is drawn is a little subjective--some versions have it violated already), there isn't much support--its look out below from a technical standpoint.
Next is the USD
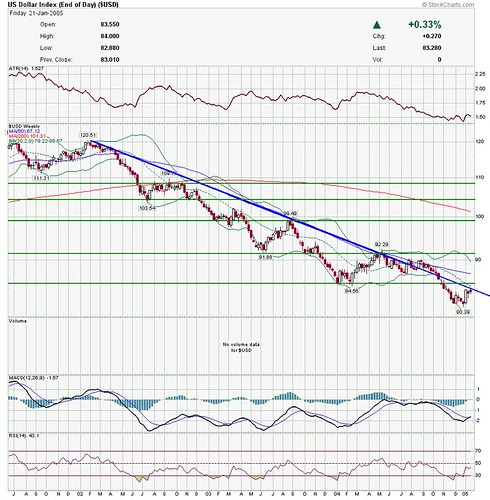
courtesy of stockcharts.com
I've shown this chart before, but it bears repeating, because it really is a beautiful chart. The USD keeps coming up to resistance, touching it, maybe even caressing it a bit, flirting with breaking through, and then breaks down to a new low. This pattern will repeat, of course, until it stops.
Next is the CRB commodities.
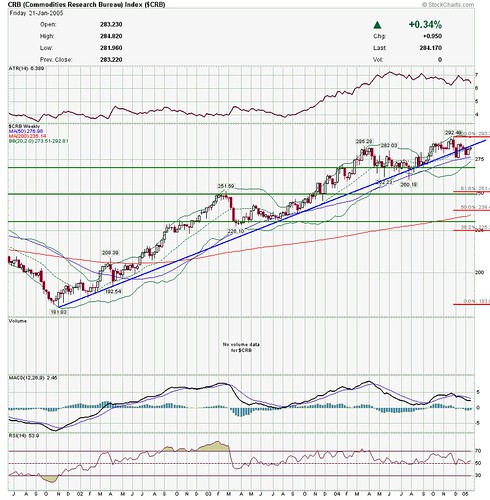
courtesy of stockcharts.com
Nice uptrend--but could it be that this long uptrend is being broken??
Could be. But I'll wait a little bit--again, I consider these lines to be a little subjective and "fuzzy".
Finally is Gold.
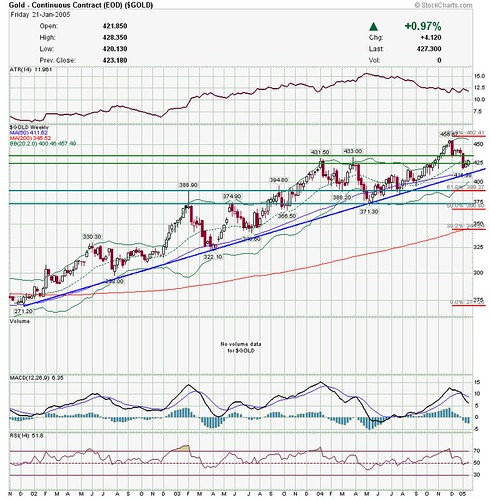
courtesy of stockcharts.com
Uptrend still intact, although not much room to manuever.
CONCLUSION
Uptrends in Nasdaq, Gold and CRB still intact, downtrend in USB still intact
BUT it won't take much for any of these to be violated.
Interesting that all of these are close to their trend lines.
We'll see what next week and another bar will bring.
No comments:
Post a Comment