Nasdaq. Weekly chart.
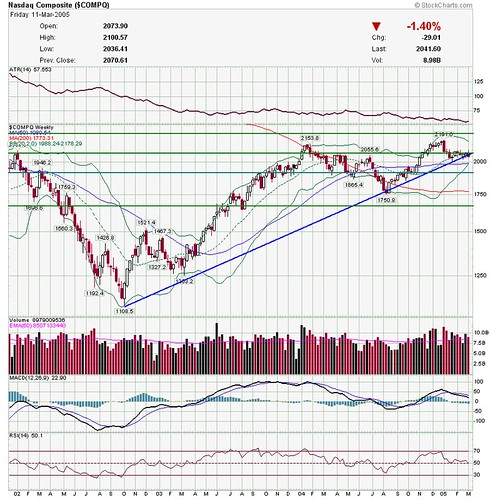
Courtesy of stockcharts.com
Boy, it's caught between a trendline and a resistance line. Let's look at it in another view. This is the Nasdaq, daily chart.
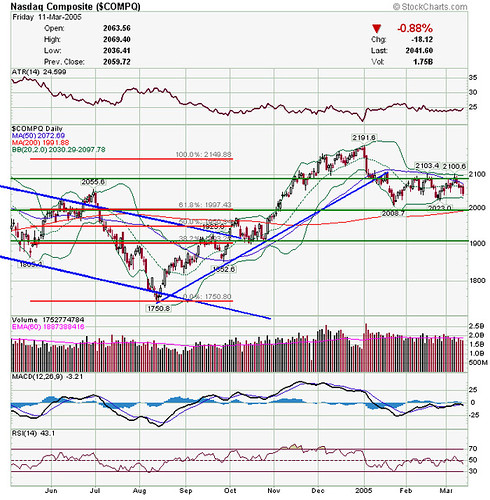
Courtesy of stockcharts.com
I still say, 2090-2100 is key on this one--if it can break above it and hold, it may run up for awhile--if it can't it's look out below.
Oil is on everybody's mind--let's first look at West Texas Intermediate Crude
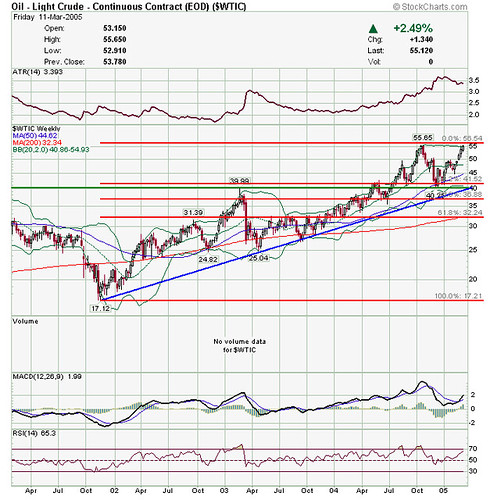
Courtesy of stockcharts.com
Uptrend, pretty strong move the last couple weeks, but bumping up against a double top. If it can't crack this, maybe a rest for a while--the support in the low 40's looks strong.
Next is the Index of Oil stocks--the OIX
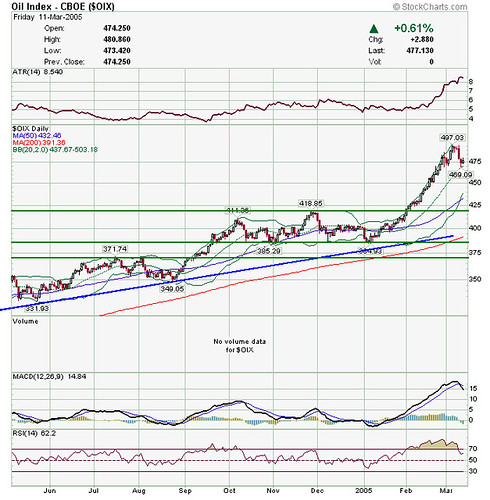
Courtesy of stockcharts.com
Well, we all knew that parabolic up move couldn't last. Where will the downmove find support? Remember, don't try to catch a falling knife--wait for it to bounce, or better yet come to rest.
Next is a new one--the VIX
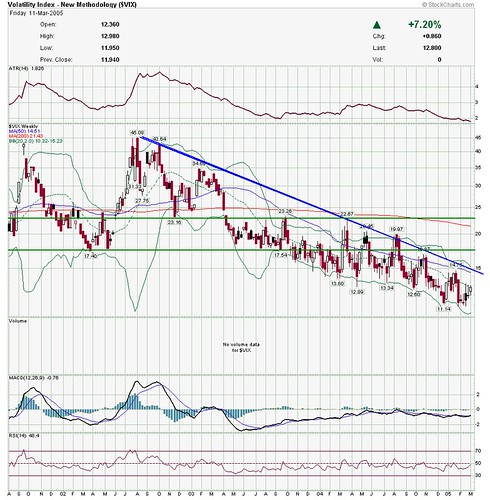
Courtesy of stockcharts.com
No fear here. The downtrend will continue until it reverses.
And in the continuing saga of commodities, the CRB
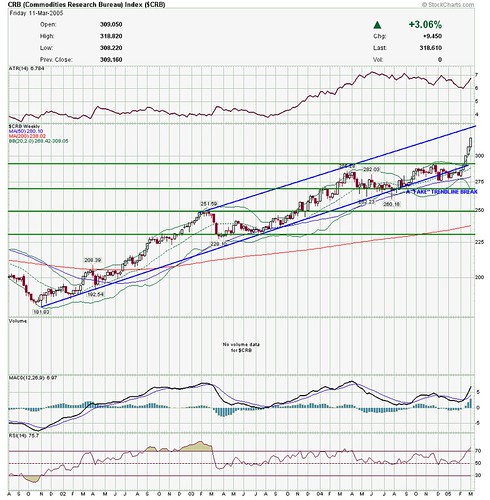
Courtesy of stockcharts.com
After a little fake out, the uptrend continues with a vengeance.
Finally, Warren Buffett's favorite short, the USD
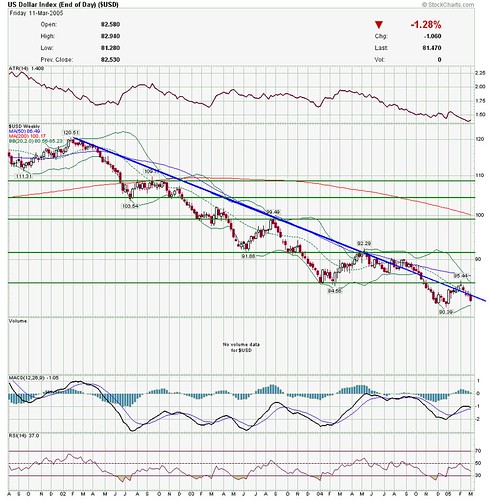
Courtesy of stockcharts.com
The downtrend continues.
Have a great week everyone!
No comments:
Post a Comment