Exxon Mobil right now is one of the largest publicly traded companies, with a market cap of over 400 billion. The simple fundamental metrics are that it has a PE of 16, compared to ChevronTexaco's 10 and the industry's 13. Its P/Sales is 1.35, compared to CVX 0.87 and the industry's 1. Its PEG is 2.3, compared to 2.4 and 1.7 respectively. Nothing jumps out at me there. I'm sure my colleagues will do a better job with strict fundamental analysis than I could--thus I want to look at this stock in a little different way.
I used a tool that I talked about here, when I was appropriately challenged on canadian royalty energy trusts, and whether their prices were related more to oil prices, or interest rates. I did a simple correlation between the price of XOM and the price of crude, specifically West Texas Intermediate Crude oil. The results confirm what one would expect--the share price of XOM correlates well with the price of crude. Over the past 2 years, the correlation is 0.91 (remember, 1 is perfect correlation, and 0 is no correlation, i.e. random). Over the past year, however, the correlation is 0.75, and over the past month it is 0.69. The point, of course, is that even two instruments that correlate can get out of whack from time to time. (I realize there are lots of potential problems with this sort of correlation analysis--I'm using only a period with an up oil market, sometimes things correlate until they don't, etc. Still I think it is useful.)
So what do the technicals look like?
Weekly chart
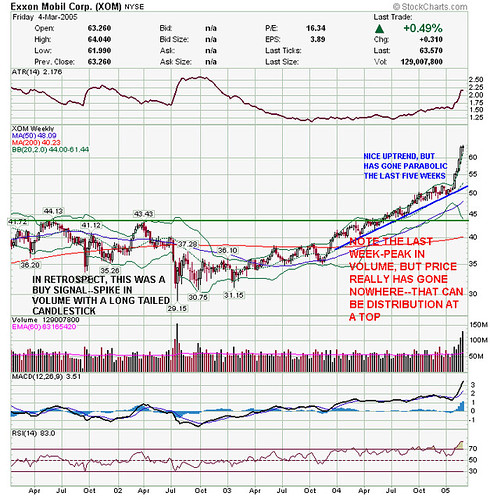
courtesy of stockcharts.com
An uptrend, with a big parabolic move in the past few weeks. Besides the normal common sense that a move like that is unsustainable, look at the high volume spike the last week, without any real move in the price. Distribution? Maybe/maybe not, but it does make one a little more wary. (In the 20/20 hindsight department, note also the big volume spike in July 02 with a long-tailed candlestick--in retrospect, a sure sign of a bottom).
In summary, XOM over the long term tracks the price of crude oil pretty well. If you think crude will continue up, XOM is an easy way to play that--but not right now! Wait for a major correction, and then this may be a good way to be long crude oil.
1 comment:
Looks like you have once again nailed it on the nose. XOM had a huge reversal yesterday leading the entireenergy sector down and you called it well in advance. Good job.
Post a Comment