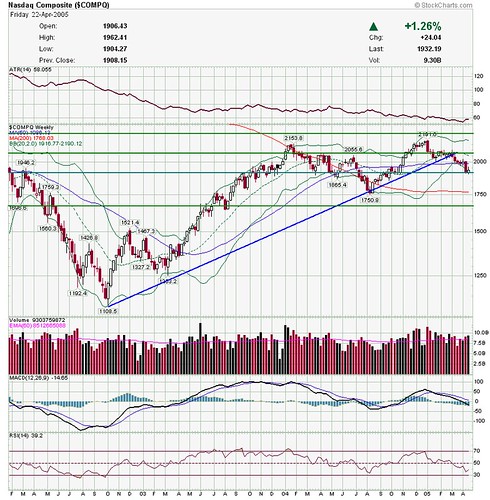
Courtesy of stockcharts.com
Pretty much right at longer term support. If this holds, might be good for another upswing--but it will have to plow through some congestion.
Next is the CRB
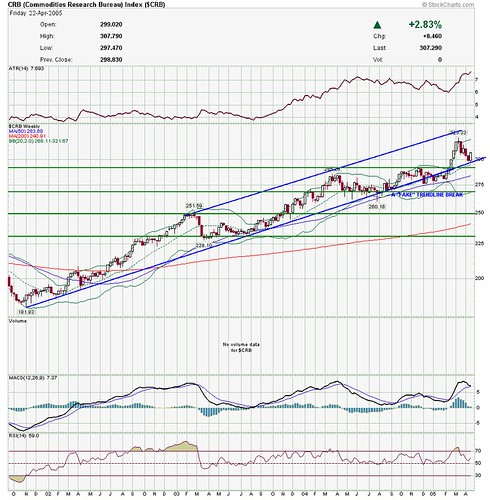
Courtesy of stockcharts.com
Nice bounce off the uptrend line.
Gold.
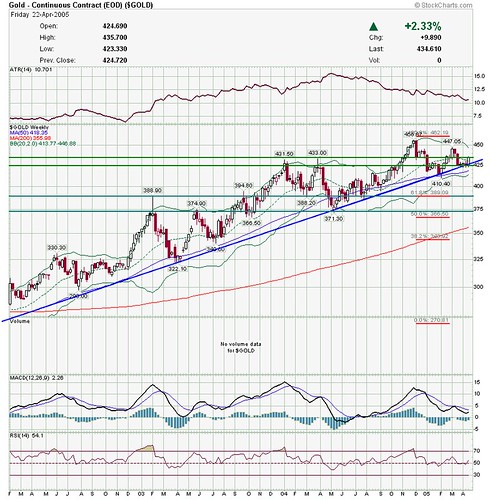
Courtesy of stockcharts.com
Ditto.
VIX
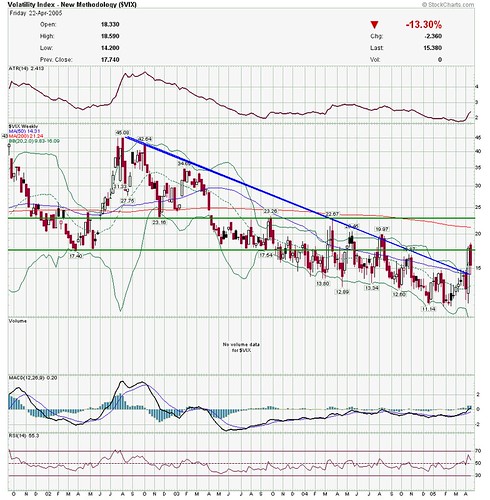
Courtesy of stockcharts.com
Most significant jump in fear in quite a while. Even after pullback, still above the long term downtrend line.
USD
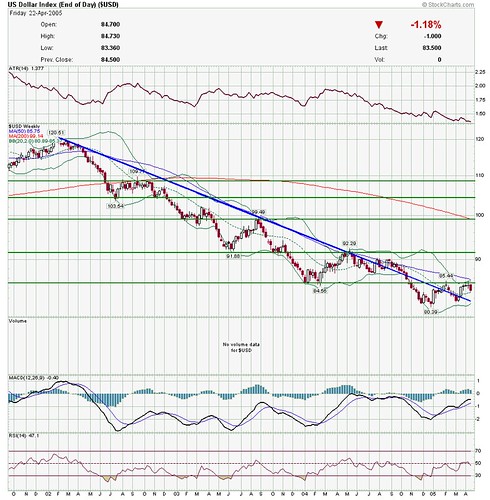
Courtesy of stockcharts.com
Kind of in no man's land, really. Has broken the downtrend, but I wouldn't really call the downtrend "over" till it can convincingly break above the last intermediate high (which is the same as a previous low) at above 85.
Black gold--WTIC.
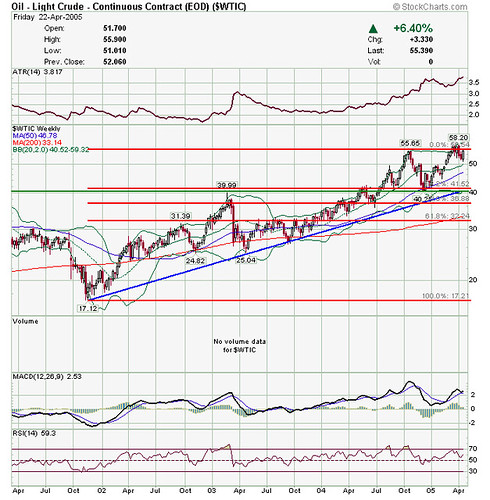
Courtesy of stockcharts.com
If it clears that double top, we could be in for another leg up.
Next is the CME
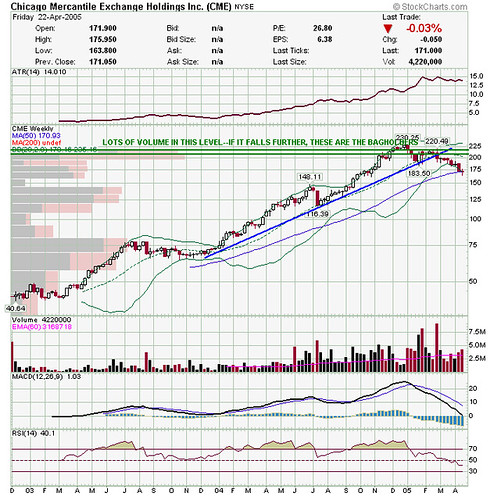
Courtesy of stockcharts.com
This one is looking like it could be a short, but not just yet--still too much of an uptrend.
TNX
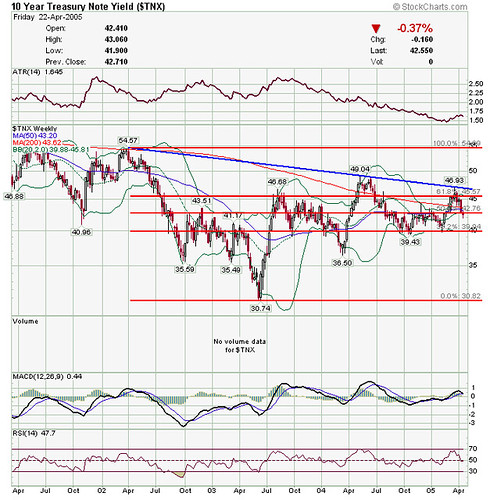
Courtesy of stockcharts.com
Still falling long term rates.
Have a great week everyone!
No comments:
Post a Comment