Courtesy of stockcharts.com
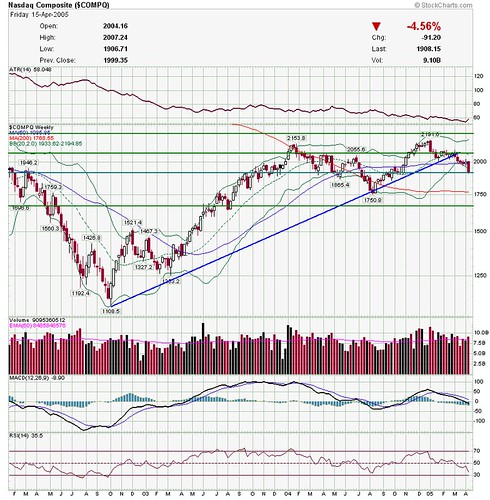
Uptrend is broken, has pulled back to support, a bounce here could be buyable.
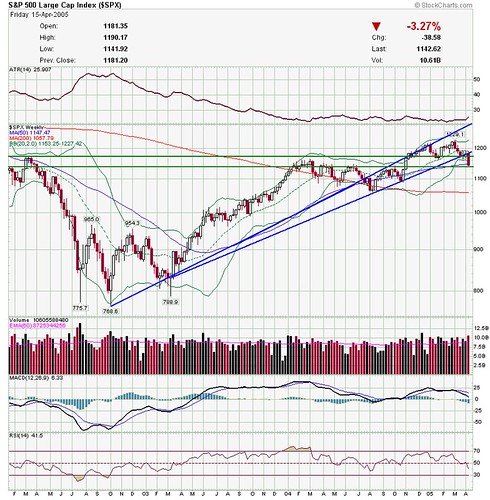
Now here is the S&P 500
Courtesy of stockcharts.com
Similarly, significant drop, but has pulled back to support. Two indices at a buyable support--but ONLY if they show strength
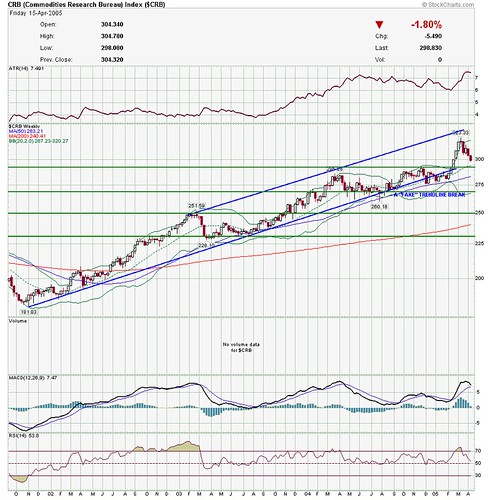
Next is the CRB
Courtesy of stockcharts.com
A pullback here, but still a solid uptrend--and, this actually looks more buyable than the equities, since the uptrend is still intact.
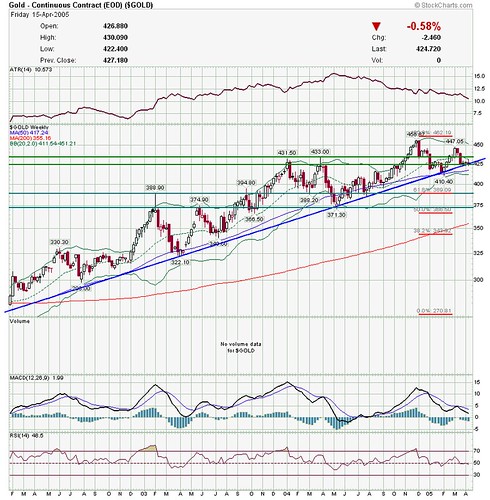
Gold.
Courtesy of stockcharts.com
Hugging that uptrend line. Probably a good low risk entry here.
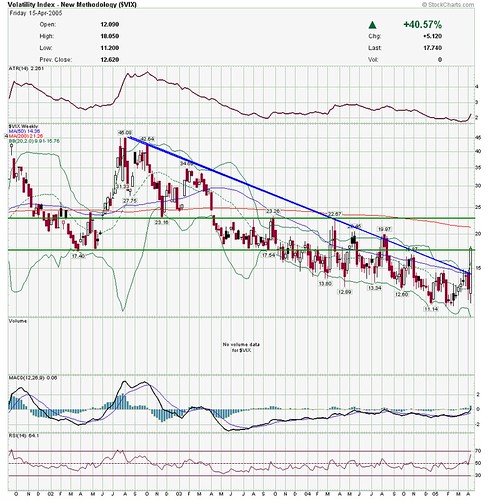
VIX
Courtesy of stockcharts.com
Finally a big spike in fear, but by historical standards, not that much of a spike.
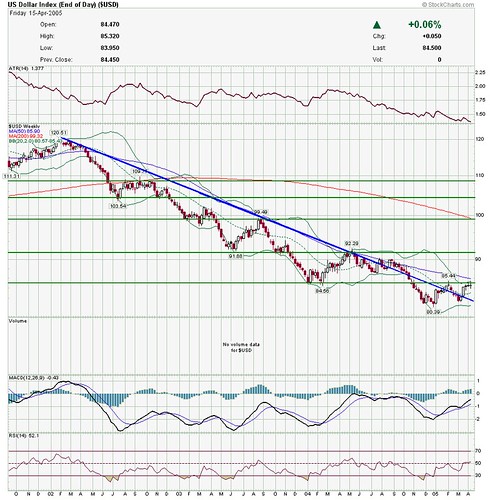
Now the continuing saga of the USD
Courtesy of stockcharts.com
Still flirting with that resistance. The downtrend is in trouble, although not yet broken.
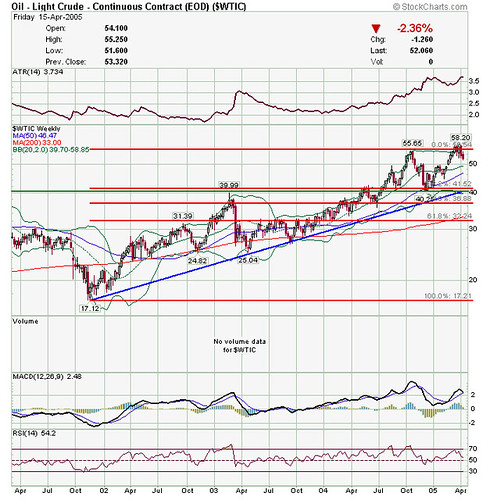
Black gold--WTIC.
Courtesy of stockcharts.com
Coming off of a double top, but still a solid longer term uptrend.
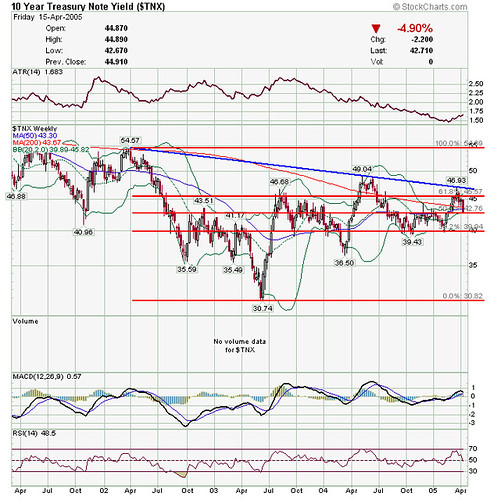
TNX
Courtesy of stockcharts.com
Where the heck are those rising interest rates???
Have a great week everyone!
No comments:
Post a Comment