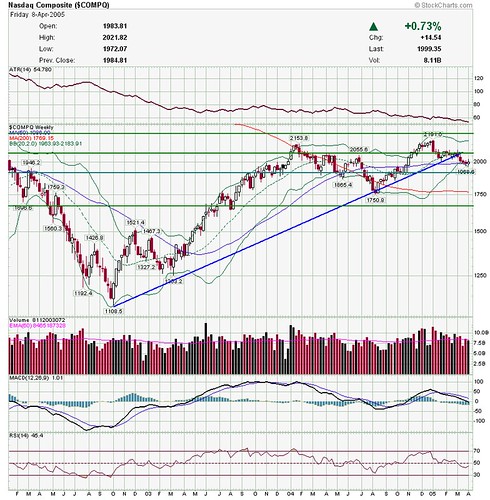
Courtesy of stockcharts.com
Uptrend is broken, now sitting at the 50 day. Needs to show a lot of strength from here to be a medium term buy.
A new one--TPL
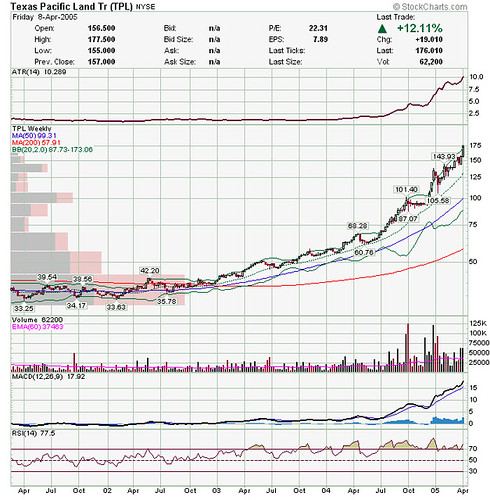
Courtesy of stockcharts.com
Thinly traded expensive stock, that has made some people a lot of money over the past couple years.
Next is the CRB
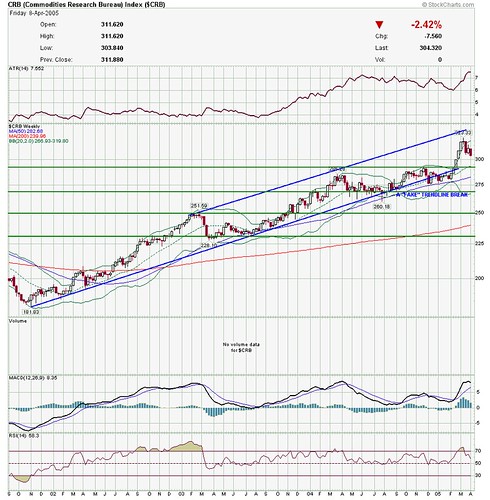
Courtesy of stockcharts.com
A pullback here, but still a solid uptrend.
Gold.
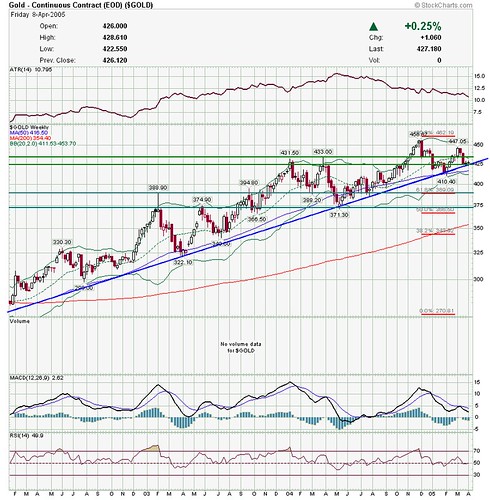
Courtesy of stockcharts.com
Hugging that uptrend line. Probably a good low risk entry here.
VIX
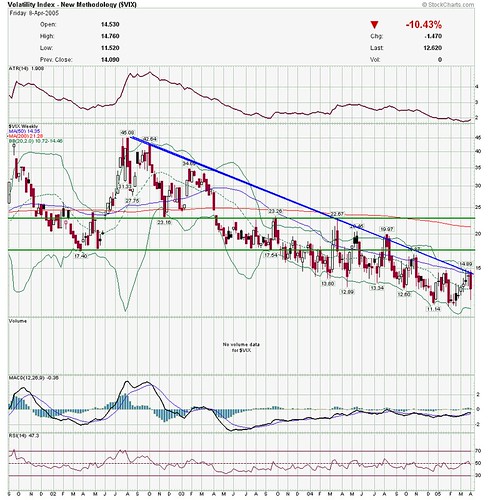
Courtesy of stockcharts.com
Everytime a little fear appears, it gets scared off.
Now the continuing saga of the USD
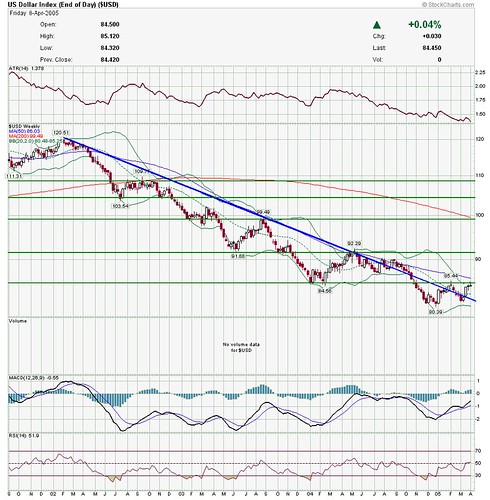
Courtesy of stockcharts.com
This is starting to get real interesting. One solid up week and the downtrend could be broken.
Black gold--WTIC.
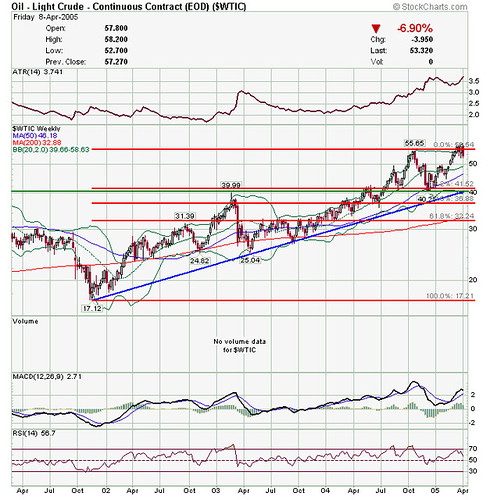
Courtesy of stockcharts.com
Double top, but still a solid longer term uptrend.
Next is one I've done a lot of handwringing about--CME
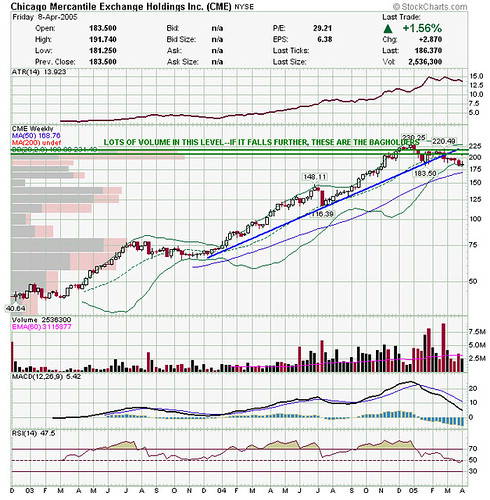
Courtesy of stockcharts.com
This one is looking like it could be a short, but not just yet--still too much of an uptrend.
TNX
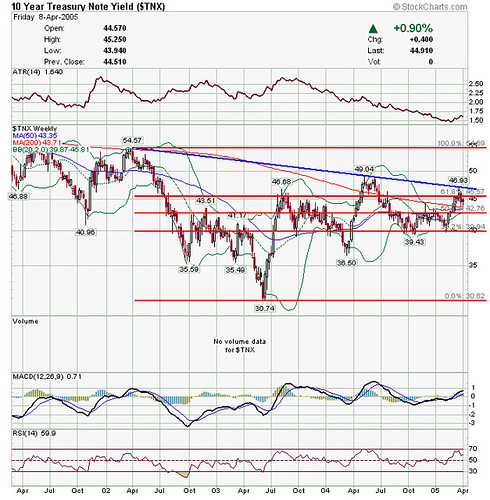
Courtesy of stockcharts.com
Falling long term rates???
Finally is a monthly chart of GM.
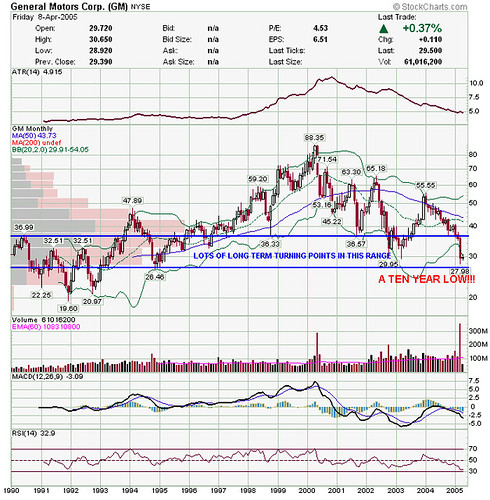
Courtesy of stockcharts.com
At a ten year low. If you subscribe to the theory that the time to buy Dow stocks is when they are beaten down, then it's time to buy this one.
Have a great week everyone!
No comments:
Post a Comment