Courtesy of stockcharts.com
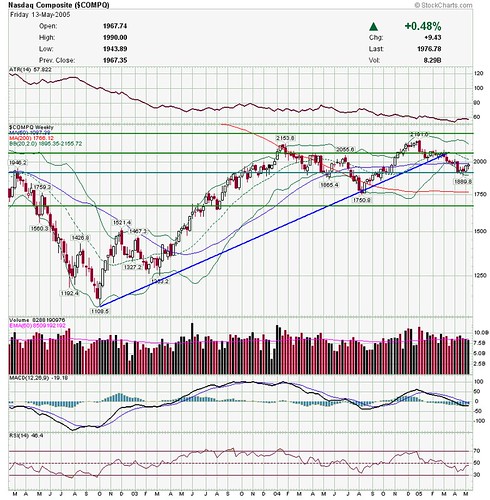
Rangebound between about 2100 and 1900--pretty boring, huh? Just wait, the fun is only started.
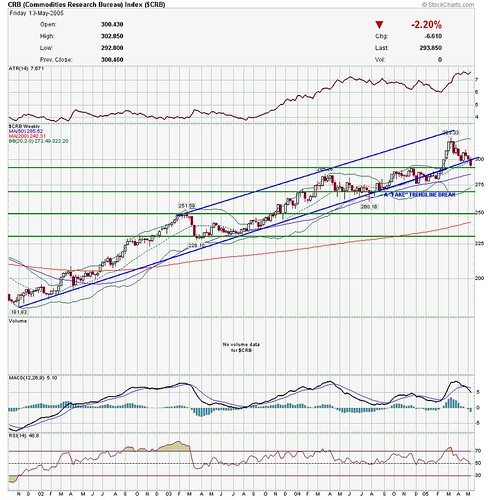
Look at the CRB
Courtesy of stockcharts.com
Break of the uptrend line, and I'd say that 300 has to hold to stay bullish.
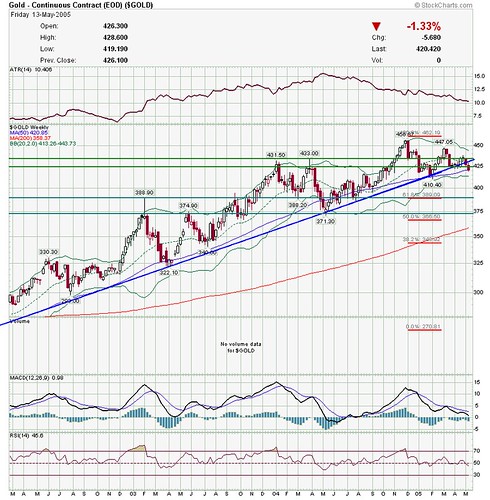
Gold.
Courtesy of stockcharts.com
Support is not holding--this is the worst this chart has looked for the bulls in months.
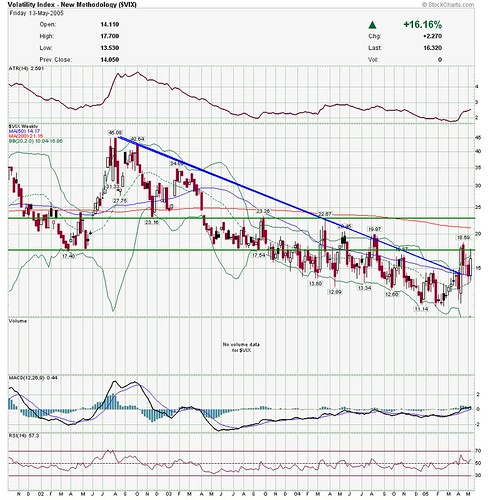
VIX
Courtesy of stockcharts.com
THIS is significant--has the VIX found support above the old downtrend line?
And last but not least, the USD
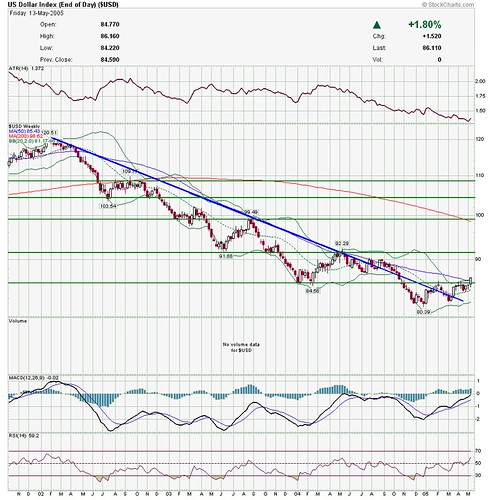
Courtesy of stockcharts.com
By George, I think the dollar's downtrend is broken!
So, I'm seeing potential turning points in the CRB, Gold, the buck, and volatility.
I think that means something . . .
Have a great week everyone!
No comments:
Post a Comment